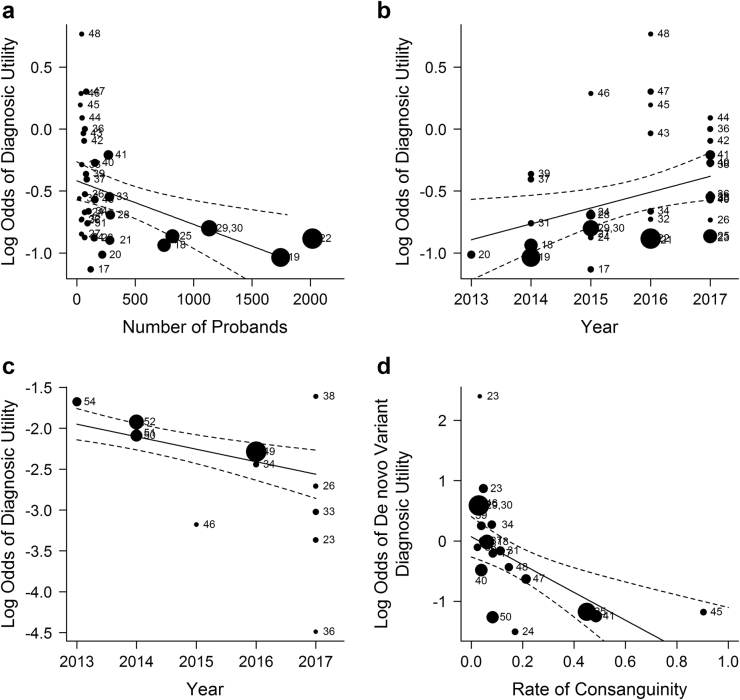
Fig. 2.
Exploration of heterogeneity of diagnostic utility in WGS and WES studies. a Meta-regression scatterplot for study size. On average, an increase of 1000 subjects decreased the odds of diagnosis by 28% (P = 0.01). Size of data point corresponds to the study’s inverse-variance weight. b Meta-regression scatterplot for diagnostic utility of WGS/WES vs year of study publication. On average, the odds of diagnosis increased by 16% per annum since 2013 (P = 0.01). c Meta-regression scatterplot for the diagnostic utility of CMA vs year of study publication. The odds of diagnosis decreased by an average of 14% per year between 2013 and 2017 (P < 0.001). d The rate of diagnosis associated with de novo variation varied inversely with consanguinity. On average, increasing the rate of consanguinity by 10% decreased the odds of de novo variant diagnoses by 21% (P < 0.001)

