Fig. 1.
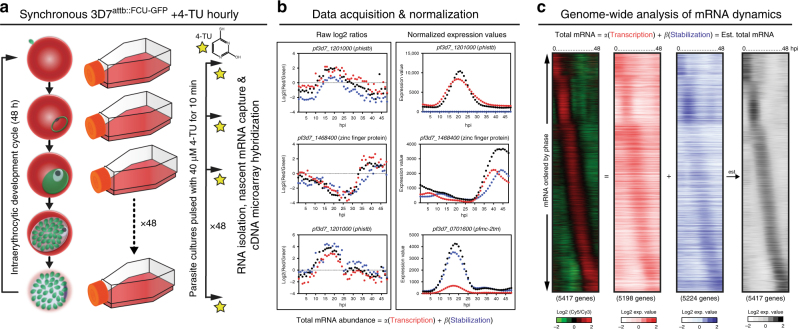
Biosynthetic mRNA labeling and capture throughout the P. falciparum IDC reveals complex developmental mRNA dynamics. a Biosynthetic mRNA capture timecourse with 4-TU (40 µM) labeling (10 min pulse) of highly synchronous transgenic 3D7attB::fcu-gfp parasites every hour throughout the 48 h IDC followed by total RNA extraction. 4-TU labeled RNA is separated from the total RNA resulting in two fractions, transcribed (labeled) and stabilized (unlabeled). These RNAs and the total cellular RNA pool were quantified by DNA microarray analysis (Supplementary Fig. 2). b Data obtained by cDNA microarray was normalized and modeled to determine the contribution of nascent transcription (red circles) and stabilization (blue circles) to the total abundance profile (black circles) for each gene. c The modeled expression values of nascent transcription (5207 genes, red) and stabilization (5236 genes, blue) values for each gene were ordered based on the peak timing of total abundance (5428 genes) during the 48 h IDC as determined by Lomb-Scargle analysis and displayed in a heatmap as the log2 expression value. The summation of the expression values for both transcription and stabilization is displayed as a heatmap representing the estimated total mRNA abundance (5207 genes, black), recapitulating the canonical phaseogram of measured total mRNA abundance (left, RGB heatmap)

