Fig. 3.
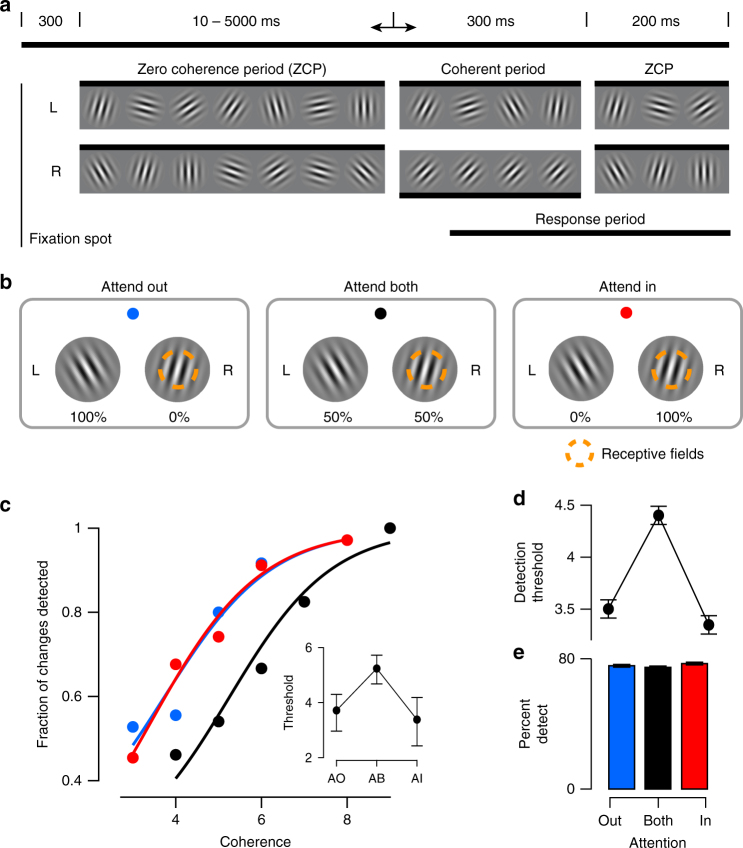
Task diagram with behavioral results. a Orientation change-detection task. Two stimuli (L: left, R: right) randomly change their orientation during the ZCP (length 10–5000 ms). One stimulus (R in this example) then enters the CP (300 ms) when the signal orientation is shown (coherence exaggerated for clarity). This period is followed by another 200 ms ZCP to allow time for a behavioral response. b Illustration of attention conditions. Attention is cued according to fixation spot color. This color scheme is used in all figures to represent each condition. Percentages below the stimuli indicate the probability that the change occurs in this stimulus on a given trial. One stimulus overlaps the recorded neurons’ receptive fields. c Example session psychophysical performance. Individual points represent fraction of changes detected at a given coherence. Solid lines indicate fit of logistic function to the data. Inset shows 50% detection threshold with 95% CIs. d Behavioral summary. Same as inset in c, but averaged across sessions in our dataset (N = 30; mean ± SEM). e Percentage of changes detected in each condition averaged across sessions (mean ± SEM)

