Fig. 4.
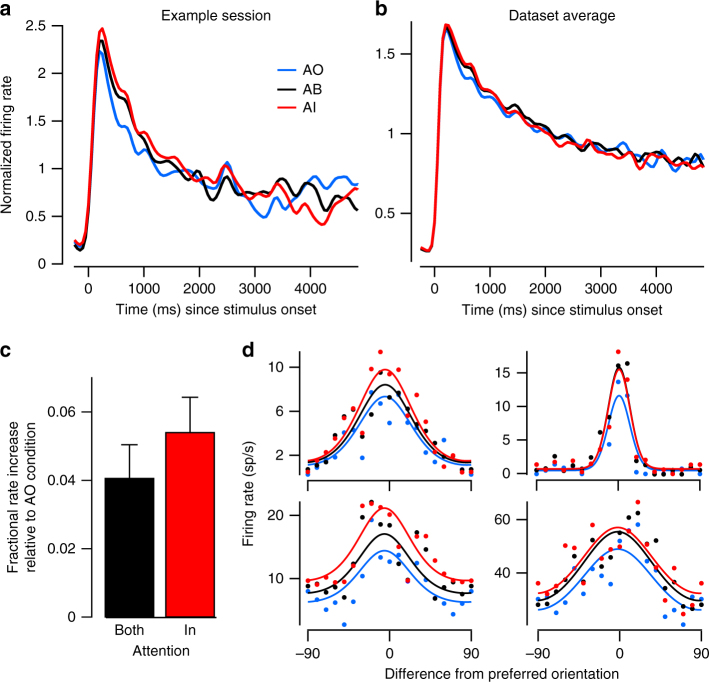
Attentional modulation of neuronal responses. a Example session spike density function for each condition, normalized to the average response in AI condition (mean across units). b Same as a but averaged across sessions (N = 30). Attentional modulation is confined primarily to the first second following stimulus onset. c Fractional increase in firing rates in the first second following stimulus onset in the AB and AI conditions relative to the AO condition averaged across sessions (N = 30; mean ± SEM). d Example single unit tuning curves in AI, AB, and AO conditions. Dots show responses to specific orientations; solid lines show fitted von Mises functions

