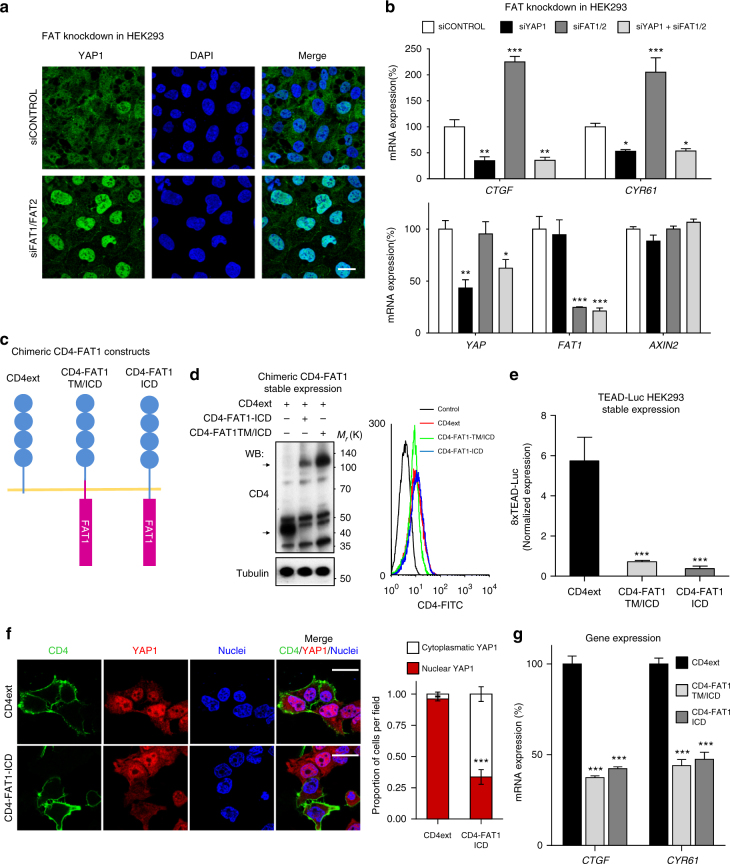
Fig. 2.
FAT1 regulates YAP1 nuclear localization and activity. a siRNA-mediated knockdown of FAT1 and FAT2 in HEK293 cells induces the accumulation of nuclear YAP1 as depicted by immunofluorescence and its associated quantification. In green (Alexa 488), YAP1 staining and in blue, the nuclear counterstain DAPI. A representative experiment is shown. Scale bar, 25 µm. b Knockdown of FAT1 and FAT2 induces the upregulation of the YAP1 targets CTGF and CYR61 in HEK293 cells in a YAP1-dependent manner. Gene expression analysis of HEK293 cells transiently transfected with siRNAs against control (scrambled), YAP1, FAT1, and FAT2 as indicated. mRNA levels were evaluated by quantitative PCR (qPCR). Bars represent the GAPDH-normalized mean ± SEM (N = 3). c Schematic representation of the CD4-FAT1-ICD chimeric constructs. d Expression and correct plasma membrane localization of the CD4 chimeras by western blot and FACS. Arrows indicate the specific CD4-chimera bands. Predicted molecular weights CD4ext 46 kDa and both CD4-FAT1 91 kDa. e TEAD-Luciferase reporter assay in HEK293 cells stably transfected with the CD4-FAT1 chimeric constructs. Luciferase expression was evaluated in exponentially growing cultures 36 h after transfection. Bars represent mean Renilla-normalized luciferase expression ± SEM (N = 4). f Transient overexpression of CD4ext and CD4-FAT1-TM/ICD induces YAP1 nuclear exclusion in HEK293 cells 24 h after transfection. A representative immunofluorescence is shown. The nuclear or cytoplasmatic localization of YAP1 was visually evaluated in at least 100 transfected CD4 positive cells from three independent experiments and their quantification is shown in the right panel. Bars represent mean proportion ± SEM of the nuclear and cytoplasmatic localization of YAP1. Scale bar, 20 µm. g Quantitative PCR depicting gene expression levels of the YAP1 transcriptional targets CTFG and CYR61 in HEK293 stably expressing CD4-FAT1 ICD constructs. Bars represent the GAPDH-normalized mean ± SEM (N = 3). *P < 0.05, **P < 0.01, ***P < 0.001 (One-way ANOVA)

