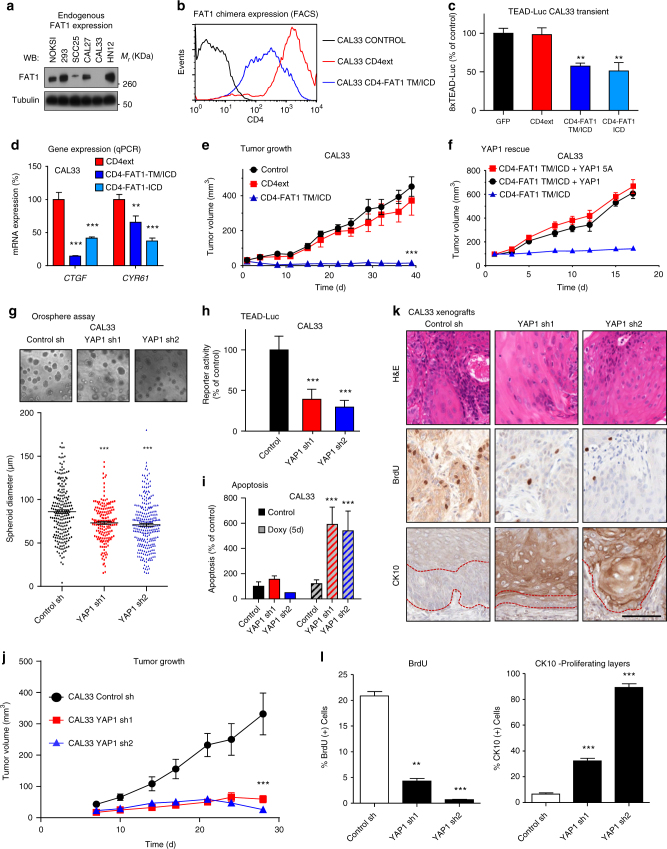
Fig. 4.
YAP1 is required for HNSCC survival and proliferation in vitro and in vivo. a Analysis of FAT1 expression in a panel of epithelial cells, including HNSCC. b Expression of CD4ext and CD4-FAT1-TM/ICD chimera in the HNSCC cell line CAL33 by CD4 FACS analysis. c TEAD-Luciferase reporter assay in CAL33 cells transiently transfected with the CD4-FAT1 chimeric constructs. Luciferase expression was evaluated in exponentially growing cultures 36 h after transfection. Bars represent mean Renilla-normalized luciferase expression ± SEM (N = 4). d Quantitative PCR depicting gene expression levels of the YAP1 transcriptional targets CTFG and CYR61 in CAL33 stably expressing the CD4-FAT1 ICD constructs. Bars represent the GAPDH-normalized mean ± SEM (N = 3). e In vivo xenograft assay. One million CAL33 cells expressing indicated constructs were injected in nu/nu mice. Data points represent mean volume (N = 10 tumors per group) ± SEM. f YAP-rescue experiments. In vivo flank xenograft assay as in (e) using CAL33 expressing CD4-FAT1-TM/ICD and control or the indicated YAP expression vector. Data points represent mean volume (N = 10 tumors per group) ± SEM. g Spheroid formation assay of stable CAL33 shRNA control and YAP1 shRNA cell lines. Representative pictures are shown on top and diameter quantifications (>200 colonies per group) are shown below. Black lines represent mean ± SEM. h CAL33 stably expressing control and YAP1 shRNAs were stimulated with doxycycline for five days (1 µg/ml) and then transfected with a 8xTEAD-luciferase reporter. Renilla-normalized reporter activity is expressed as % of control. Bars represent mean ± SEM (N = 4). i Apoptosis assay by propidium iodide staining of CAL33 cell lines expressing control or YAP1 shRNA after 5d of Doxycycline stimulation. Bars represent mean ± SEM (N = 4). j In vivo xenograft assay. One million cells were injected in nu/nu mice. Animals were fed Doxycycline food (6 g/Kg) ad libitum 24 h h after tumor cell injection for the duration of the experiment. Data points represent mean volume per group (N = 10 tumors) ± SEM. k Representative immunohistochemical stainings of CAL33 tumors from panel (j). In the Cytokeratin 10 (CK10) panels the dotted red line delimits the proliferating front of the tumor. Scale bar, 100 µm. l Automated histological quantification of stainings in (k), bars represent mean ± SEM (N = 3). **P < 0.01, ***P < 0.001 (One-way ANOVA)

