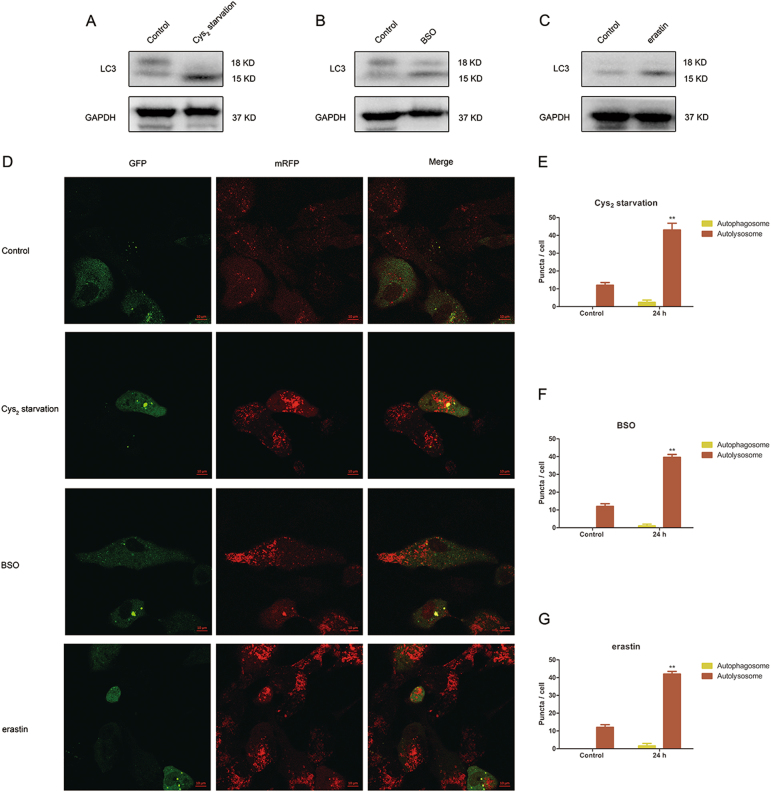
Fig. 5. GSH depletion triggers autophagic activation accompanied by an increasing autophagic flux.
(a–c) represent autophagy activation in Cys2 starved, 1000 µM BSO, and 10 µM erastin-treated RPE cells, respectively, by detect LC3 using western blot. d After being exposed to Cys2 starvation milieu, 1000 µM BSO and 10 µM erastin for 24 h, representative images of ARPE-19 cells displaying LC3 puncta were immediately visualized by confocal microscopy. Number of autophagosomes represented by yellow puncta and autolysosomes represented by red puncta in merged images. Scale bar, 10 µm. (e–g) represent quantified data depicted in (d). Red puncta and yellow puncta were counted and calculated as number per cell. Data represent mean ± SD from one of three representative experiments. Representative data from one of three experiments are shown. ** represent p < 0.01

