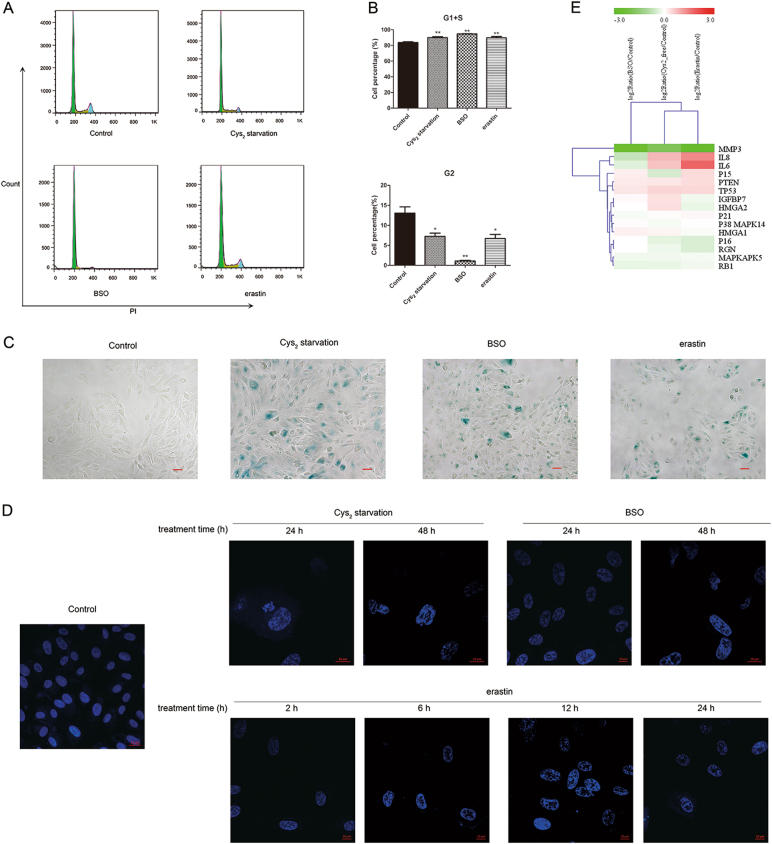
Fig. 7. GSH depletion arrests cell growth and induces premature cell senescence.
a Cell cycle analysis by PI staining in cells treated with Cys2 starvation, 1000 µM BSO, and 10 µM erastin. (b) represent quantified data depicted in (a). Proportion of cells in G1 + S phase and G2 phase were calculated. Data represent mean ± SD from one of three representative experiments. Representative data from one of three experiments are shown. * represent p < 0.05, ** represent p < 0.01. c Images of senescence β-galactosidase staining. Cells were treated with Cys2 starvation, 1000 µM BSO, and 10 µM erastin for 24 h, respectively. Scale bars: 50 μm. d GSH-depleted cells were stained with DAPI to show SAHFs. e Senescence-associated gene profiles of Cys2 starved and 1000 µM BSO and 10 µM erastin-treated ARPE-19 cells. Total RNA was extracted at 24 h post treatment and assayed on BGISEQ-500 RNA-Seq

