Figure 4.

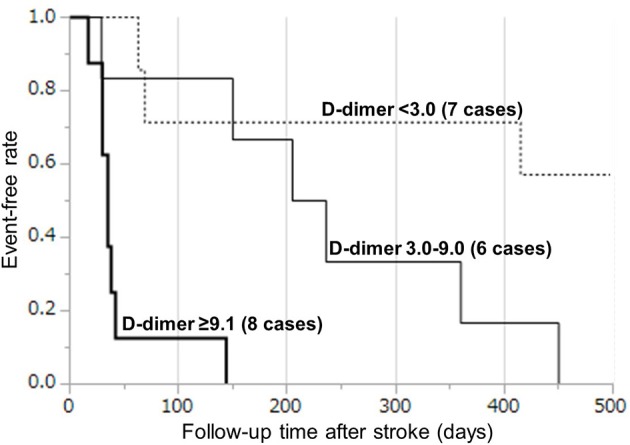
Kaplan–Meier curves by tertiles of D-dimer levels during days 7–28. The survival rate was analyzed by a Kaplan–Meyer survival curve using tertiles of D-dimer levels: (1) < 3.0 μg/mL, (2) 3.0–9.0 μg/mL, and (3) ≥9.1 μg/mL.

Kaplan–Meier curves by tertiles of D-dimer levels during days 7–28. The survival rate was analyzed by a Kaplan–Meyer survival curve using tertiles of D-dimer levels: (1) < 3.0 μg/mL, (2) 3.0–9.0 μg/mL, and (3) ≥9.1 μg/mL.