
Figure 2.
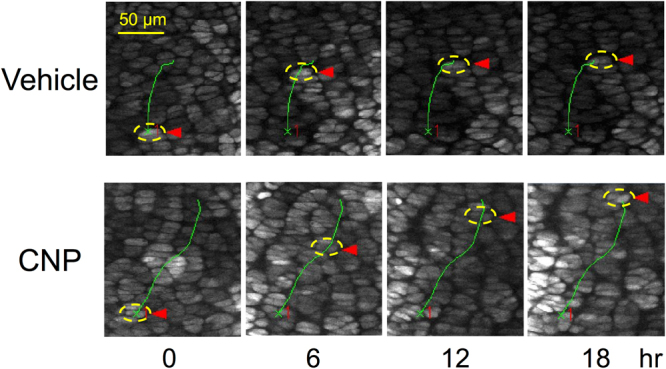
Trajectory of a chondrocyte in the proliferative zone in vehicle (upper panels) or CNP (lower panels)-treated growth plate organ culture. Pictures in each vertical lane represent the snap shots at indicated time point (hour). Targeted chondrocyte is encircled by yellow dashed ellipse marked by red arrowhead at each time point, which is located on the full trajectory indicated by the same green line, appearing in each set of pictures. The ‘x’ numbered ‘1’ in red character in each snap shot exhibits the start point of the trajectory of the targeted chondrocyte in vehicle or CNP-treated group.