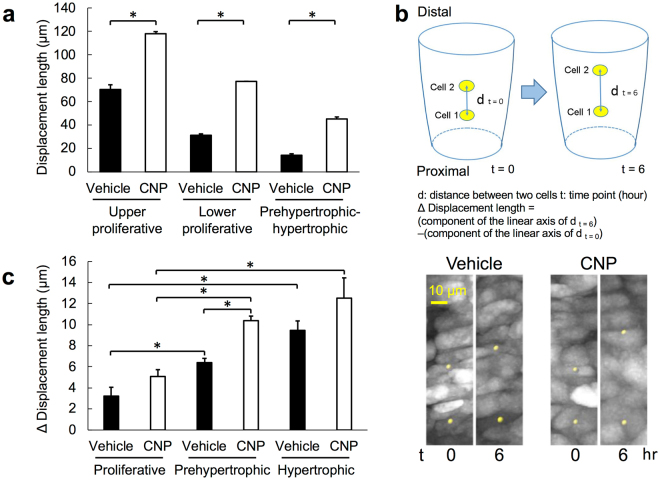
Figure 3.
Cell displacement length analyses, based on a Cartesian coordinate system (see “Methods”). (a) The displacement length of each chondrocyte measured as the distance along the longitudinal growth of the growth plate, set the boundary line between the calcified bone shaft and the growth plate cartilage as the baseline. Results of chondrocytes in distinct zones of the growth plate are shown. (b) Upper panel: a schema representing the displacement length of chondrocytes defined as the distance between two distinct chondrocytes. Each outer frame represents the distal ulnar growth plate and the yellow ellipse represents the chondrocyte. d: distance between two cells, t: time point (hour), Δ displacement length = (component of the linear axis of d t = 6)−(component of the linear axis of d t = 0). Lower panels: representative views of marked chondrocytes (yellow points) at t = 0 and t = 6. Left: vehicle-treated and right: CNP-treated. (c) Δ displacement length of two distinct chondrocytes in the proliferative, prehypertrophic, and hypertrophic zones. Closed and open bars represent vehicle and CNP-treated groups, respectively. (a) and (c), n = 5, *P < 0.05.

