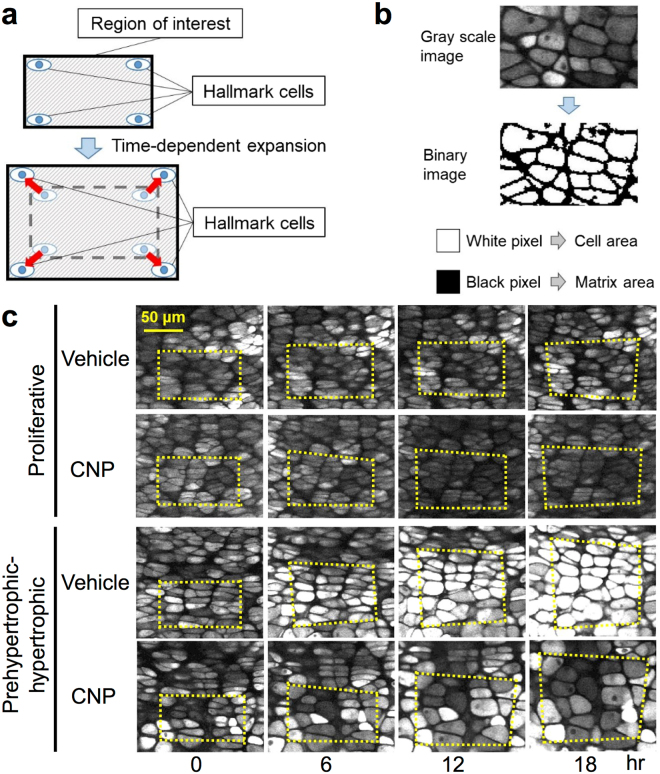
Figure 4.
Schematic representation of the methods of pixel analyses (a,b) and the practical images used in the analyses (c). (a) Hallmark cells were set in the corner of the region of interest (ROI) at time point 0 hours; an area of ROI at time point 0 hours was set about 6,000 pixels. The ROI at each time point was cropped based on the hallmark cells. (b) Binarization processing using MetaMorph. Cell areas were set as white pixels and extracellular matrixes as black pixels. (c) Practical images used in pixel analyses in the proliferative (upper panels) and prehypertrophic-hypertrophic (lower panels) zones. In series of pictures in each zone, vehicle-treated (upper pictures) and CNP-treated (lower pictures) are indicated at each time point. Yellow dashed quadrangle indicate the ROIs.

