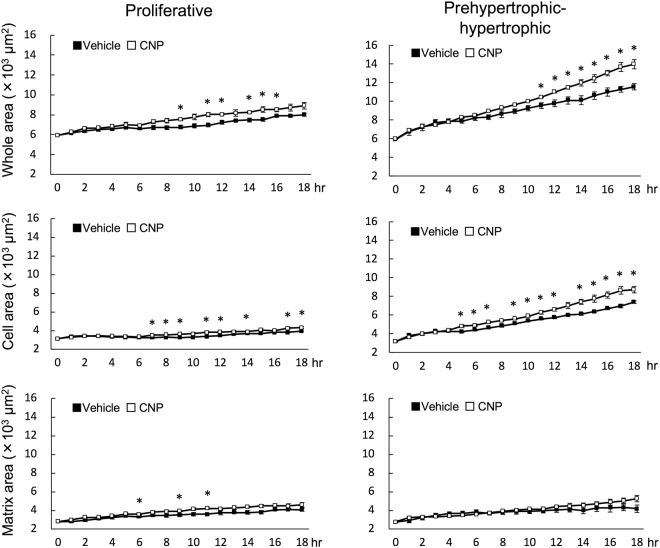
Figure 5.
Pixel analyses of whole and segmented areas in the growth plate. Left panels represent the results of the proliferative zones and right panels show those of the prehypertrophic-hypertrophic zones. Upper, middle, and lower panels show the whole area, segmented cellular, and matrix areas, respectively. Pixel analyses were performed using binary images for 18 hours. Closed and open circles represent vehicle and CNP-treated groups, respectively. n = 3, *P < 0.05.

