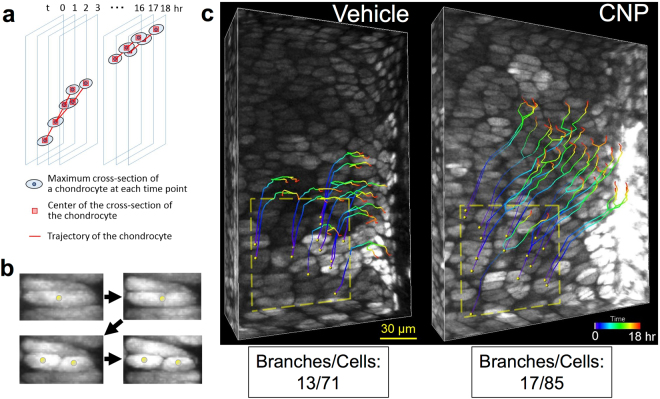
Figure 7.
Analysis of the proliferation of growth plate chondrocytes using IMARIS. (a) Schema of the method. The maximal cross-section of a targeted chondrocyte was provided at each time point, and the center of the cross-section of the chondrocyte was manually connected for 18 hours using IMARIS. Mitotic division is represented as a branched line, as indicated. (b) A representative series of pictures showing the division of a proliferative chondrocyte. Yellow spheres indicate the centers of the maximal cross-sections of chondrocytes. (c) All proliferative chondrocytes located within a distinct rectangle (depicted by yellow dashed lines) in an imaginary plane were traced, but only the trajectories of dividing chondrocytes are shown. Left, vehicle and right, CNP-treated groups. Colored lines represent trajectories of proliferating chondrocytes divided during the 18-hour observation period. Each branch of the line means mitotic division of a proliferative chondrocyte. The total numbers of branches by all cells traced in vehicle and CNP-treated groups are also indicated.

