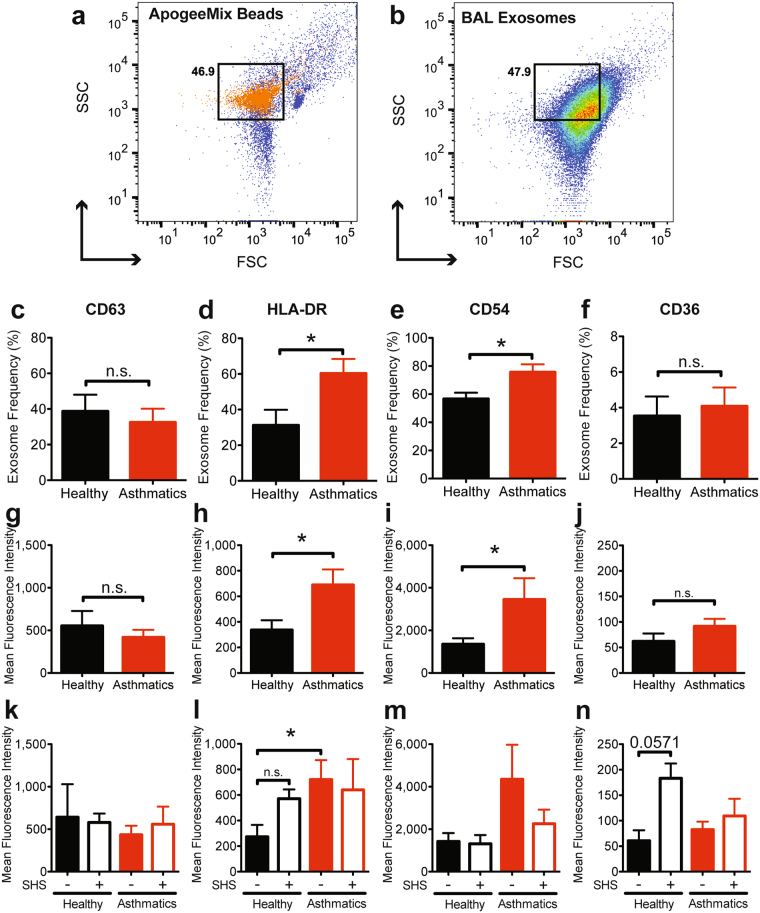
Figure 2.
Characterization of EVs by flow cytometry. (a) ApogeeMix beads used to calibrate a BD LSRII to identify location of exosomes based on size. (b) A representative forward and side scatter of BAL EVs. (c) Frequency of CD63+ EVs. Mann Whitney T test, * < 0.05. (d–f) Frequency of EVs positive for HLA-DR, CD54, or CD36, after gating on CD63+ EVs. Mann Whitney T test, * < 0.05. (g,h) Mean fluorescence intensities of each marker analyzed on BAL EVs. Black bars represent healthy subjects (including SHS-exposed), and red bars represent asthmatics (including SHS-exposed). Mann Whitney T test, * < 0.05. (k–n) Mean fluorescence intensities of each marker analyzed on BAL EVs for each study group. Solid black bars represent healthy subjects, open black bars represent healthy subjects exposed to SHS, solid red bars represent asthmatics, and open red bars represent asthmatics exposed to SHS. Mann Whitney T test, * < 0.05; (Healthy Subjects, n = 9; Asthmatic Subjects, n = 9).

