Figure 2.
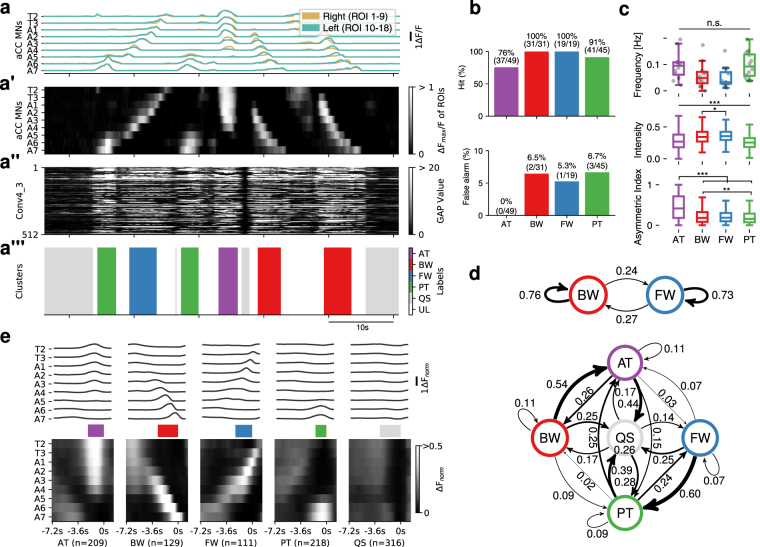
Evaluation and characterization of fictive motor patterns classified by deep convolutional feature. (a) An example of extracted motor patterns (a”’) from the activity data (a) Intermediate layers, the pre-processed 9-d time series displayed as a grayscale image (a’) and global average pooled values of Conv4_3 (a”), are also shown. AT, anterior burst; BW, backward wave; FW, forward wave; PT, posterior burst; QS, quiescence state; UL, unlabeled, represented in different colors as shown in the color-code bar. T2-T3, thoracic segment 2 to 3; A1-A7, abdominal segment 1 to 7. See Fig. S1a for details. (b) Evaluation of the extracted motor patterns. Hits (top) and false alarm (bottom) for the four motor patterns are shown. (c) Frequency (top), intensity (middle) and symmetry (bottom) of the four motor patterns extracted from 12 samples. Intensity represents the maximum fluorescence change (ΔFnorm) among all ROIs during each motor pattern. Asymmetric index is defined as the difference of the maximum ΔFnorm in the left and right ROI divided by the maximum ΔFnorm in all ROIs at each time-frame. *p < 0.05, **p < 0.01, ***p < 0.001, ANOVA with post-hoc Tukey HSD test. (d) Markov chain of fictive motor patterns. Transition probabilities derived from 2 states (BW and FW, top) and 5 states (AT, BW, FW PT and QS, bottom). Thickness of arrows represents the transition probability between the motor patterns. Note that the arrow from QS to QS is omitted due to lack of space. (e) Averaged fictive motor patterns. Line plot (top) and grayscale image (bottom) are shown aligned with the end points of each motor pattern. Colored bars in the middle represent the average duration of each motor pattern (AT:2.2 ± 0.1 s, BW:2.8 ± 0.1 s, FW:2.3 ± 0.1 s, PT:1.5 ± 0.1 s, QS:2.9 ± 0.3 s, mean ± standard deviation).

