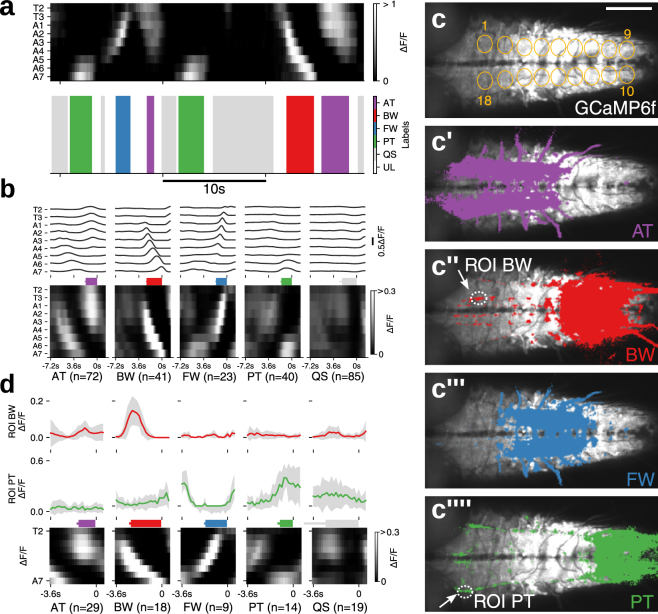
Figure 3.
Motor pattern extraction from activity data of whole neurons. (a) An example of extracted motor patterns (bottom) from the activity data derived from pan-neuronally expressed GCaMP6f (top, grayscale image) (b) Mean of fictive motor pattern dervied from 3 samples aligned with the end point of each label. Average duration of each motor pattern, AT:1.8 ± 0.1 s, BW:2.4 ± 0.1 s, FW:1.7 ± 0.1 s, PT:1.6 ± 0.1 s, QS:2.3 ± 0.4 s (mean ± standard deviation). Note that unnormalized ΔF/F is shown since normalization obscured the motor pattern. (c) Motor pattern correlation mapping. Voxels with >0.1 Pearson’s r for each motor pattern, AT (c’), BW (c”), FW (c”’) and PT (c”’), are shown in colors. c shows the 18 ROIs used for the analyses (visual cues). Image baselines are derived from maximum GCaMP signal. (d) Neural activity in the structures identified by the correlation mapping. The average activity in the structures identified as specific to BW (top) and PT (middle) during each motor pattern (bottom). Scale bar 100 μm.

