Figure 3.
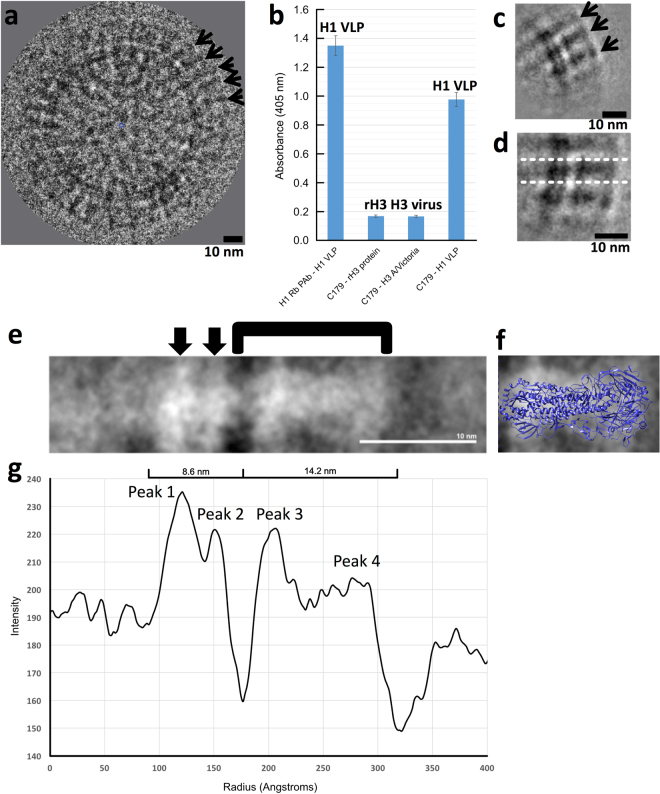
Hemagglutinin (HA) conformation and epitope integrity on virus-like particles analyzed by 2D image analysis and reactivity to antibodies. (a) Image of a VLP by cryo-electron microscopy. Black arrows indicate some HA spikes on the surface. (b) ELISA of binding of anti-H1 rabbit polyclonal antibodies and stem antibody C179 to VLPs. H3 virus (A/Victoria/3/75 H3N2) and recombinant H3 HA (A/Wisconsin/67/05 (H3N2)) were negative controls because C179 is a broadly reactive antibody for group 1 HAs (e.g. H1, H2, H5) and does not bind group 2 HAs (e.g. H3). (c) 2D class average of spike regions from multiple VLP surfaces. Black arrows indicate HA spikes. (d) Image of panel c computationally rotated so the central HA spike (within dotted the lines) is horizontal. For panels a, c, and d protein contrast is shown as black. (e) Zoomed in view of the 2D HA averaged image. Black arrows indicate two apparent density layers. The HA ectodomain region is marked by a bracket. (f) Size and shape comparisons between the ectodomain region of the HA 2D image average and the HA crystal structure (PDBID 1RD8) by scaled image overlay. HA coordinates are in blue ribbons. Protein contrast is shown as white for the 2D average in panels e and f. Panels e and f are on the same scale. All scale bars, 10 nm. (g) 1D density profile of the HA average. The relative widths of two large major bands (8.6 nm and 14.2 nm) are denoted by labeled distance brackets that span minima. The 14.2 nm band has multiple peaks while the 8.6 nm band has two peaks.

