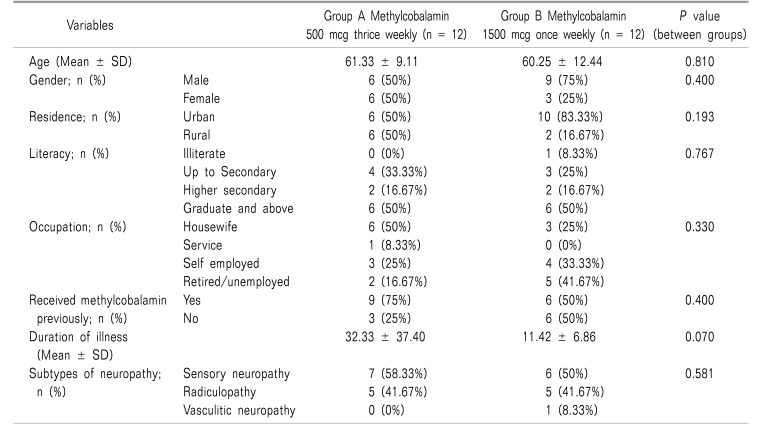
Table 1. Clinico-demographic Profile of Study Population.
n: number of subjects, SD: standard deviation, IQR: interquartile range. Normality test done by Kolmogorov Smirnov test and the data was not found to be distributed normally. P value for between group comparisons is from Mann-Whitney U test. *Denotes P value<0.001 for within group comparison between the baseline visit and the particular visit (Freidman's ANOVA followed by post hoc Dunn's test).

