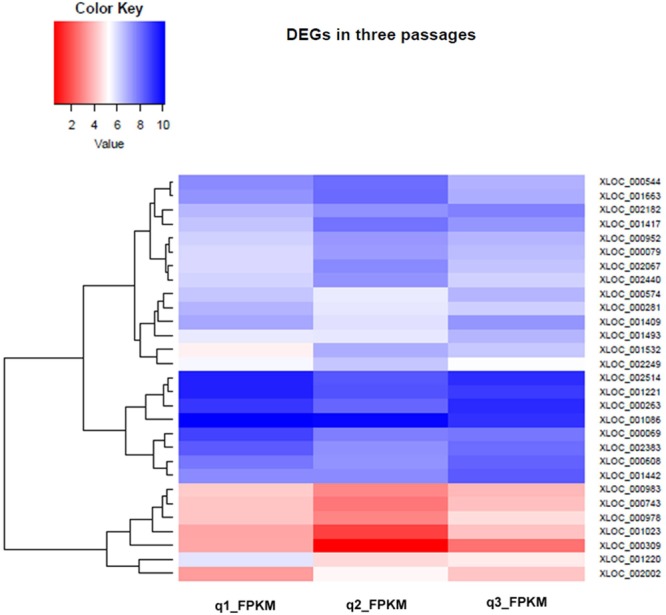
FIGURE 9.

Hierarchical Clustering Heatmap of differentially expressed genes in early, intermediate and late passages. Heat maps were generated to show the comparative log 2 abundance ratios between early, intermediate, and late passages using RNAseq data. Upregulated proteins are depicted by blue bars, downregulated proteins by red bars.
