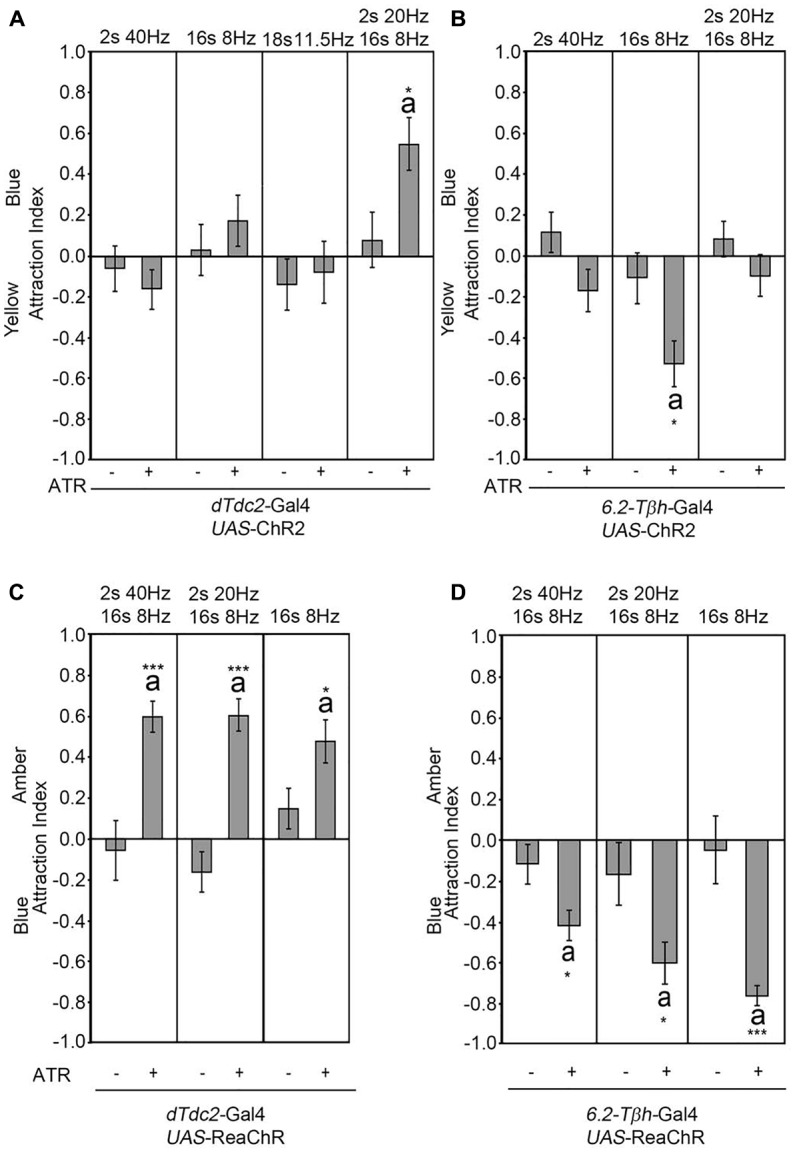
Figure 3.

Frequency-dependent activation results in attraction. Different flicker patterns indicated above the panel were used to activate neurons in a dTdc2-Gal4-dependent manner (A,C) and 6.2-Tβh-Gal4-dependent manner (B,D). Only activation with a flicker of 2 s at 20 Hz, 16 s at 8 Hz followed by 2 s of silence continues to elicit site attraction (A, AIs of the control and experimental group: −0.08 ± 0.14 and 0.55 ± 0.13, respectively; n = 27, 23). (B) The 8 Hz pattern is sufficient to elicit site aversion when used to activate neurons (AIs of the control and experimental group: −0.11 ± 0.12 and −0.53 ± 0.11, respectively; n = 20, 14). (C) Activation with UAS-ReaChR in a dTdc2-Gal4 dependent manner leads to site attraction (2 s at 40 Hz, 16 s at 8 Hz activation pattern: AIs of the control and experimental group: −0.06 ± 0.15 and 0.6 ± 0.08, respectively; n = 18, 18; 2 s at 20 Hz, 16 s at 8 Hz activation pattern: AIs of the control and experimental group: −0.17 ± 0.1 and 0.6 ± 0.08, respectively; n = 13, 7; 16 s at 8 Hz activation pattern: AIs of the control and experimental group: 0.15 ± 0.1 and 0.47 ± 0.11, respectively; n = 12, 8). (D) Activation with UAS-ReaChR in a 6.2-Tβh-Gal4-dependent manner results in site aversion (2 s at 40 Hz, 16 s at 8 Hz activation pattern: AIs of the control and experimental group: −0.12 ± 0.1 and −0.42 ± 0.08, respectively; n = 23, 20; 2 s at 20 Hz, 16 s at 8 Hz activation pattern: AIs of the control and experimental group: −0.17 ± 0.2 and −0.61 ± 0.1, respectively; n = 23, 16; 16 s at 8 Hz activation pattern: AIs of the control and experimental group: −0.05 ± 0.17 and −0.77 ± 0.05, respectively; n = 18, 17). Errors are SEM. Differences from random choice as determined by the one-sample sign test are labeled with the letter “a”. Student’s T-test was used to determine differences between two groups with significance levels as follows: *P < 0.05, ***P < 0.001. For data, see Supplementary Table S3.
