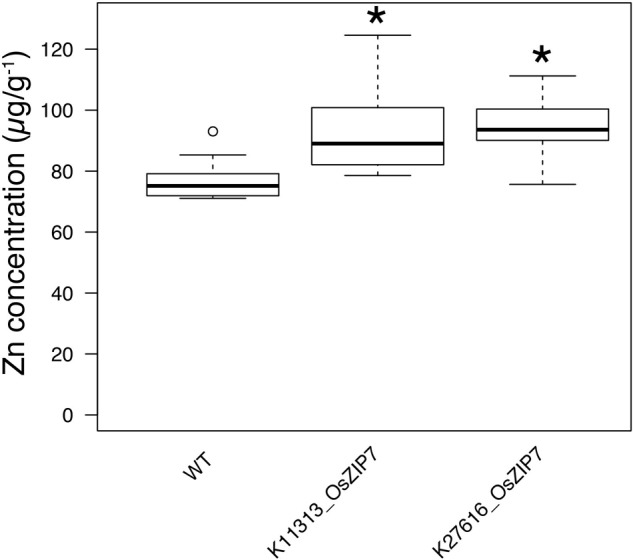
FIGURE 2.

The OsZIP7-FOX lines have higher Zn concentrations in leaves. Zn concentrations of WT, K11313-OsZIP7 and K27616-OsZIP7 (two T3 lines each) were determined by ICP-MS. Black line represents the median, box edges 1st and 3rd quartile and bars minimum and maximum values. Statistically significant differences are marked with an asterisk (Wilcoxon–Mann–Whitney test, q-value < 0.05 with Benjamini–Hochberg correction, n = 12).
