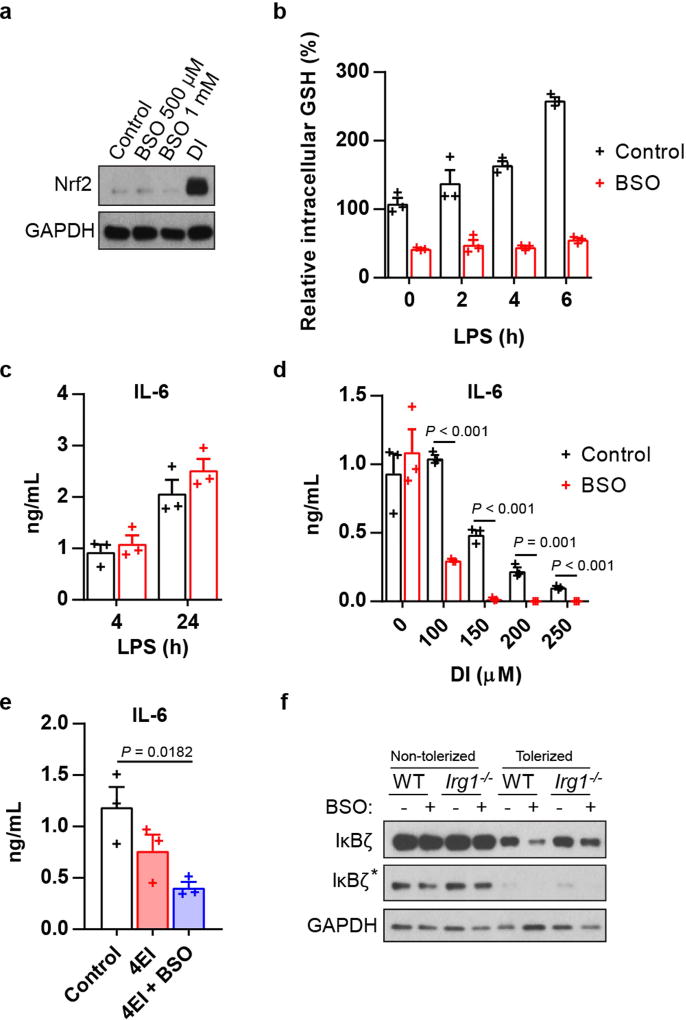
Extended Data Fig. 4. BSO potentiates the inhibitory effect of DI.
a, Western blot of Nrf2 expression in BMDMs treated with BSO or DI. b, GSH levels in BMDMs treated with BSO and stimulated with LPS. Mean ± s.e.m., n = 3 cultures. c, Cytokine production in BMDMs treated with BSO and stimulated with LPS. Mean ± s.e.m., n = 3 experiments. d, Cytokine production in BMDMs treated with DI and BSO and stimulated with LPS for 4 h. Mean ± s.e.m., n = 3 experiments. e, Cytokine production in BMDMs treated with 4EI (10 mM) and BSO and stimulated with LPS for 4 h. Mean ± s.e.m., n = 3 experiments. f, Western blot of IκBζ expression in BMDMs tolerized with LPS in the presence of BSO for 18 h and restimulated for 1 h (see Fig. 2l), asterisk shows the different exposures. Western blot data are representative of three experiments. For gel source data, see Supplementary Fig. 1. Statistical tests used were two-tailed t-tests.

