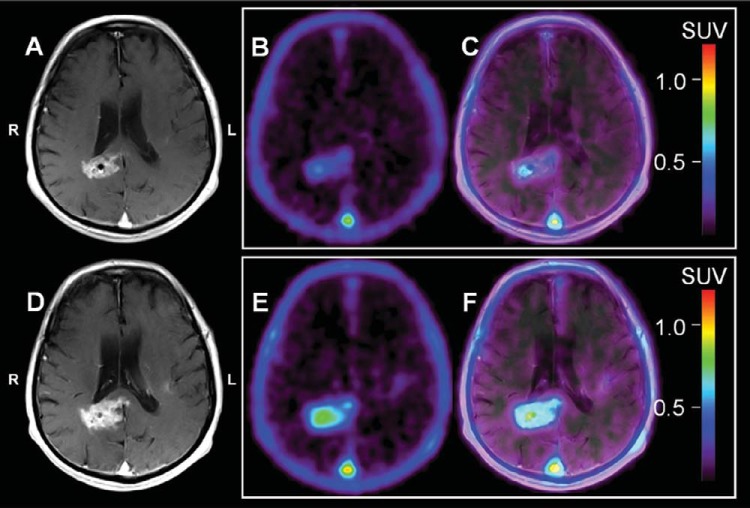
Figure 1.
Patient ML-10 #1. Representative baseline (BL; A–C) and early-therapy assessment (ETA; D–F) contrast-enhanced (CE) magnetic resonance imaging (MRI), [18F]ML-10 standard uptake value (SUV), and positron emission tomography (PET)/CE-MRI fusion images for a 72-year-old male with a new glioblastoma multiforme (GBM) diagnosis. All images are shown coregistered to the patient's BL CE-MRI. BL CE-MRI (A) shows enhancement in the region of the right periventricular white matter/splenium of corpus callosum and left insular region. ETA CE-MRI (D) shows an increase in size and contrast enhancement consistent with progression. On PET, BL [18F]ML-10 SUV image (B) shows mild therapy-naive uptake (BL SUVmax = 0.54) located at the tumor site on PET/CE-MRI (C). The ETA [18F]ML-10 SUV image (E) shows increased [18F]ML-10 uptake (ETA SUVmax = 0.84) at the GBM site (F) consistent with increased apoptosis compared with BL.

