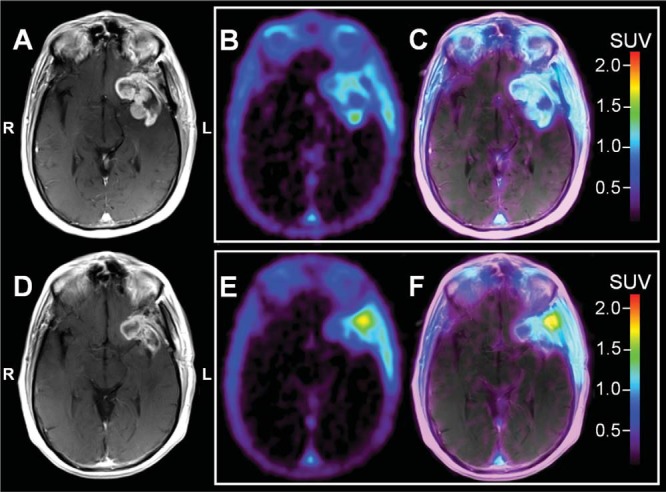
Figure 3.

Patient ML-10 #3. Representative baseline (BL; A–C) and early-therapy assessment (ETA; D–F) contrast enhanced (CE) MRI, [18F]ML-10 standard uptake value (SUV), and PET/CE-MRI fusion images for a 60 year old male with a newly diagnosed left temporal GBM. All images are shown coregistered to the patient's BL CE-MRI. Before BL imaging, the patient underwent debulking. BL CE-MRI (A) shows a large residual component of peripherally enhancing, centrally cystic mass along the margins of the resection cavity within the right anterior temporal lobe, particularly involving the amygdala, and also extending anteriorly to the right orbitofrontal region. Compared with BL, the ETA CE-MRI (D) shows a reduction in CE. There is interval resolution of previously identified midline shift and sulcal effacement. On PET, the BL [18F]ML-10 SUV image (B) shows uptake in the CE region (C). The ETA [18F]ML-10 SUV image (E) shows decreased CE-associated uptake (F); however, there is increased [18F]ML-10 uptake in the region of the lateral border (E and F), possibly related to radiation therapy/chemotherapy associated changes.
