
Figure 4.
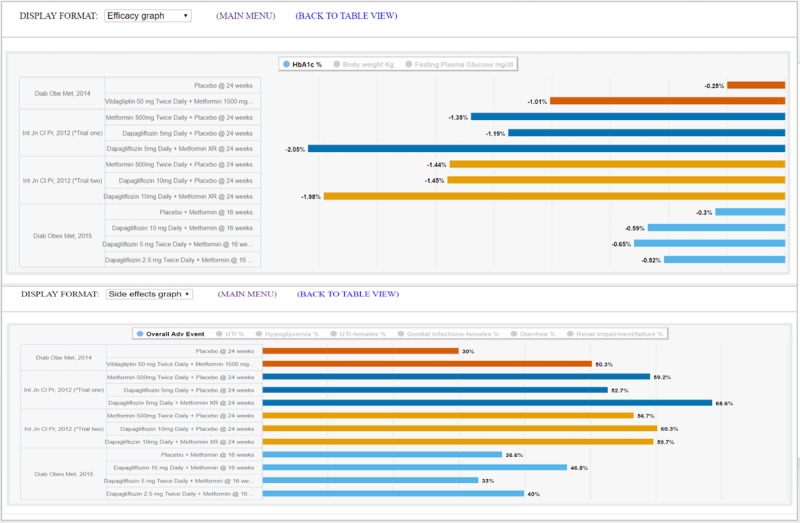
Efficacy graph display (top) and side effects graph display (bottom) with four trials on various treatments for diabetes mellitus. These two displays provide graphical comparisons of study primary outcomes and adverse effects respectively. Users can choose to set the bar graph for a specific outcome measure, overall adverse effects, or the most common adverse effect across all the arms of the selected studies.