
FIGURE 4.
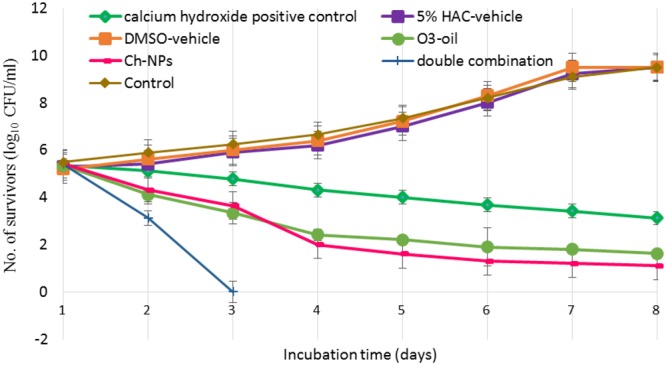
Time-kill curves showing the number of microbial survivors recorded day to day in the debris of the dentinal tubules at 400 microns to assess the effect of O3-oil, Ch-NPs, alone or in combination on the mature biofilm developed for 1 week. Data represent mean ± standard deviation.