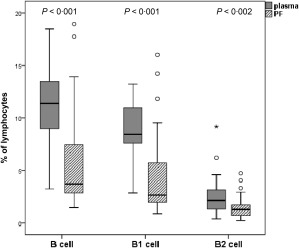
Figure 3.

Frequencies of total CD19+ B cells and B1, B2 subpopulations in plasma and pericardial fluid (PF). The percentage of all investigated B cell groups were significantly lower in PF than in plasma samples (P < 0·001, P < 0·001 and P < 0·002, respectively). Boxes show interquartile ranges (IQR), whiskers indicate lowest and highest values, horizontal lines represent medians, dots indicate outliers of 1·5 × IQR. Frequencies of cells were measured with flow cytometer. plasma, peripheral blood plasma; n = 32 patients.
