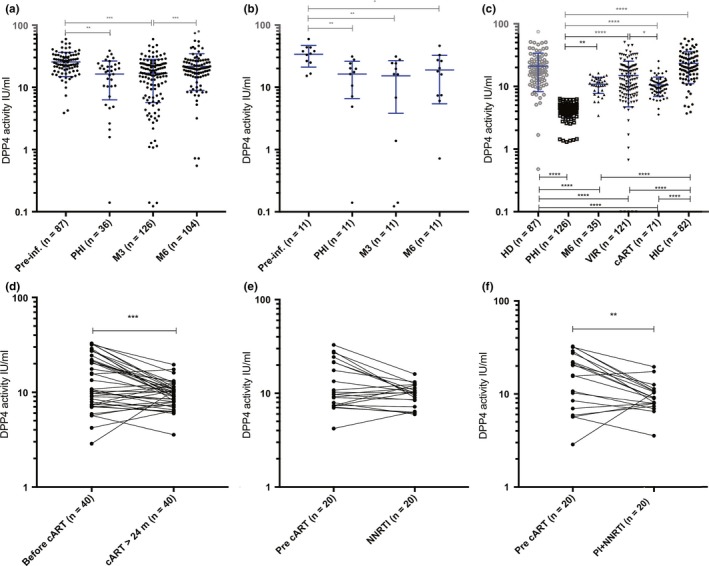
Figure 1.

Soluble DPP4 levels in blood over time during distinct phases of HIV‐1 infection. (a) Soluble DPP4 activity levels over time in patients from the Amsterdam cohort Study (ACS). Blood collected before HIV‐1 infection and at early time points post‐infection were analysed. (b). Soluble DPP4 activity levels in 11 of these patients from the ACS for whom samples at all four time points of the study were available. (c) Soluble DPP4 activity levels in healthy donors (HD), in HIV‐infected treatment‐naive patients at early time points of infection (primary infection, PHI and six months post‐PHI) from the ANRS CO6 cohort, in the chronic phase of infection (viremic patients (VIR)) from the ANRS COPANA cohort, and during controlled infection, either cART‐treated patients (cART) from the COPANA cohort and HIV controllers (HIC) from the ANRS CODEX cohort. (d‐f) Evolution of sDPP4 levels before and during cART in 40 patients from the ANRS COPANA cohort. The values from the same patient are connected through a line to show the individual evolution of the sDPP4 levels before and after cART initiation. (d) Pre‐ and post‐ART sDPP4 activity (UI/mL) in the 40 cART‐treated patients. Twenty of these patients had received Protease inhibitors (PI). (e) Pre‐ and post‐ART sDPP4 activity (UI/mL) in 20 NRTI‐based cART‐treated patients. (f) Pre‐ and post‐ART sDPP4 activity (UI/mL) in the 20 patients on cART with PI‐containing regimen. Pre‐inf. = before HIV‐1 infection; PHI = primary HIV‐1 infection; M3 = three months post‐seroconversion; M6 = 6 months post‐seroconversion (panel a‐b in the ACS) or post‐PHI (panel C in the PRIMO cohort). For graphs a, b and c, the median +interquartile range are shown. For graphs a and c, the student t‐test was used. For graphs b, d, e and f, the Wilcoxon sign‐rank test for paired data was used. *p < 0.05; **p < 0.01; ***p < 0.001; ****p < 0.0001.
