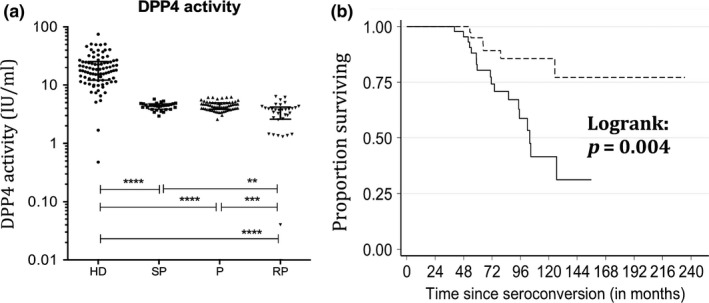
Figure 2.

Soluble blood DPP4 levels with regard to disease progression profiles. Soluble DPP4 levels were quantified during primary HIV‐1 infection in patients from the ANRS PRIMO cohort displaying distinct profiles of disease progression (SP, slow progressors; P, normal progressors; RP, rapid progressors; HD, healthy donors). (a) sDPP4 enzymatic activity per ml of blood. The median levels were 18.0 for HD, 4.4 for SP and P and 3.8 for RP. (b) Kaplan–Meier survival analysis of AIDS‐related death by sDPP4 levels measured six months after seroconversion (M6) (≤ or > to the median) in treatment‐naïve patients from the Amsterdam cohort. The dotted line corresponds to sDPP4 levels > median and the solid line to sDDP4 levels < median at M6. For graph a, the Wilcoxon non‐parametric test was used and for graph b the log‐rank test. The median and interquartile range is shown in graph a. **p < 0.01; ***p < 0.001; ****p < 0.0001.
