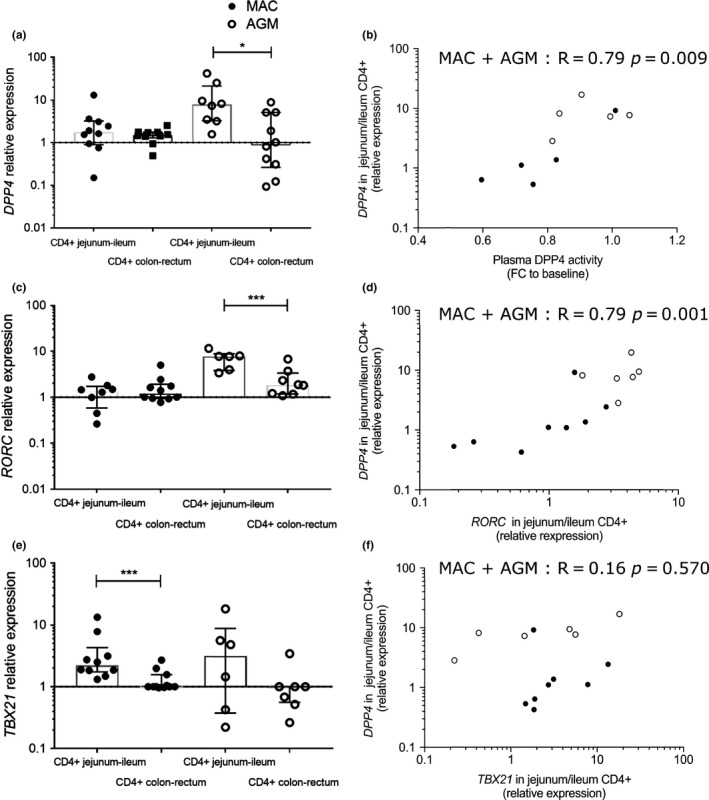
Figure 3.

DPP4 mRNA levels in the gut in pathogenic and non‐pathogenic SIV infection. (a,c,e) Four intestinal compartments (ileum, jejunum, colon, rectum) from five rhesus macaques and five AGM were studied at an early phase of infection (day 65 pi.). CD4+ leucocytes were enriched from the distinct sections of the intestine. The values for the small intestine (ileum, jejunum) and large intestine (rectum, colon) were pooled. For MAC, the available material was: jejunum, colon and rectum for five animals, ileum for three to five animals; For AGM, the available samples were: jejunum, colon and rectum for four to five animals, ileum for four to five animals). When the material was limited, we privileged the analyses of DPP4mRNA. (a) DPP4 mRNA levels in intestinal CD4+ cells. (b) DPP4 mRNA expression in CD4+ cells from the small intestine (jejunum) from the five MAC and five AGM plotted against plasma sDPP4 activity in blood from the same animals. (c) RORC mRNA levels in intestinal CD4+ cells. (d) RORC mRNA expression levels plotted against DPP4 mRNA in CD4+ cells from the small intestine. (e) TBX21 (t‐bet) mRNA levels in intestinal CD4+ cells. (f) TBX21 mRNA expression levels plotted against DPP4 mRNA in CD4+ cells from the small intestine. The correlations were statistically significant when the two species were pooled, but not within individual species. (b,d,f) Each circle represents the value of one tissue sample. Black (full circles): MAC; white (open circles): AGM. For graphs a, c and e the Wilcoxon non‐parametric test was used; for graphs b, d and f the Spearman non‐parametric correlation was used. The median and interquartile range are shown in graphs a, c and e. FC, fold change. *p < 0.05; **p < 0.01; ***p < 0.001.
