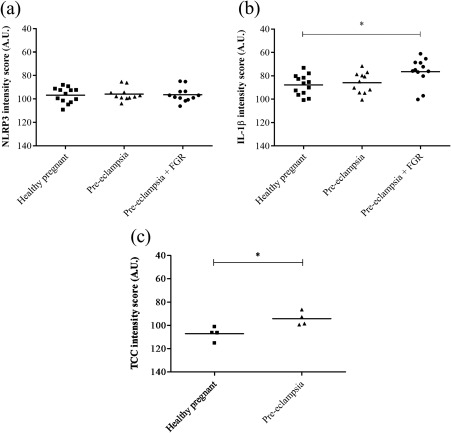
Figure 5.

Protein expression levels of Nod‐like receptor protein 3 (NLRP3), interleukin (IL)‐1β and terminal complement complex (TCC) in third‐trimester placenta. (a,b) For NLRP3 and IL‐1β the syncytiotrophoblast cytoplasmic staining was quantified in healthy (n = 13) and pre‐eclamptic placentas without (n = 11) and with (n = 12) fetal growth restriction (FGR), and data were analysed using one‐way analysis of variance (anova) with Tukey's multiple comparison post‐hoc test. (c) TCC expression level was quantified in the syncytiotrophoblast cytoplasm of healthy (n = 4) and pre‐eclamptic placentas (n = 4), and data were analysed using the two‐tailed Mann–Whitney test. *P < 0·05. AU = arbitrary units.
