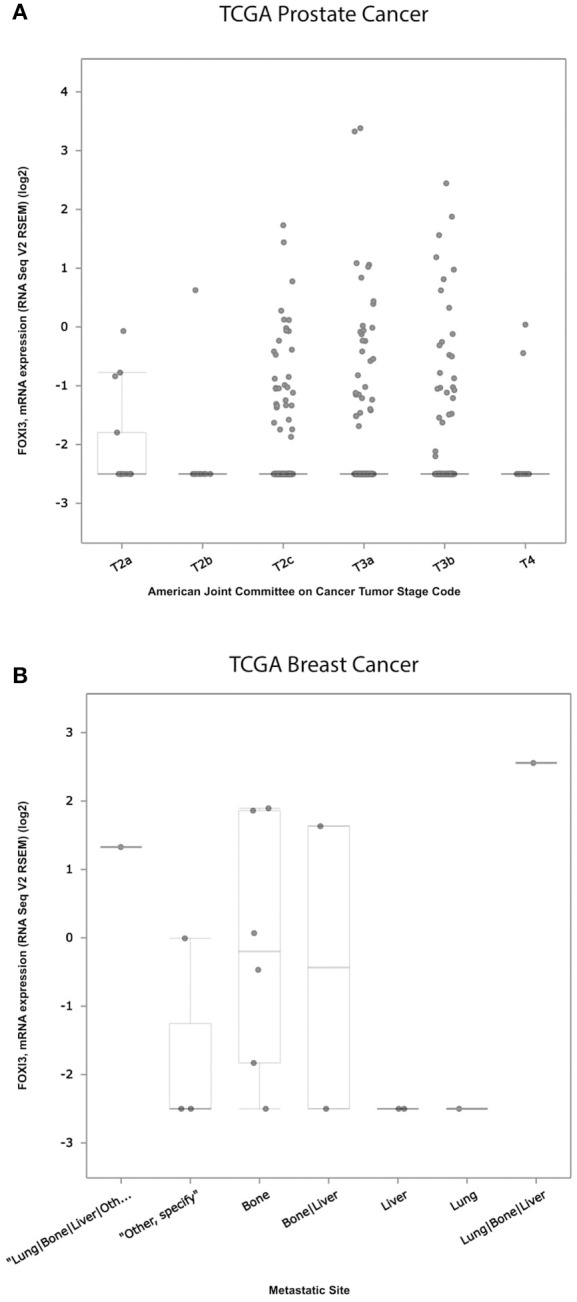
Figure 3.

Expression of FOXI3 in prostate and breast cancers. (A) RSEM normalized expression values of the TCGA prostate cancer cohort with tumor stage (Cancer Genome Atlas Research Network, 2015). (B) RSEM normalized expression values for TCGA breast tumors annotated according to site of distant metastasis (Anders and Carey, 2008). Both panels: Data was interrogated using cBioPortal (http://cbioportal.org).
