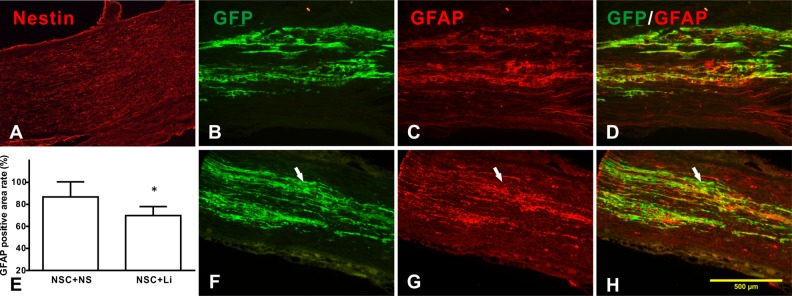
Fig. 2.
Differentiation of transplanted neural stem cells (NSCs) in tibial nerve. (A) No obvious nestin-positive expression was observed; (B–D) control group; (E) comparison of glial fibrillary acidic protein (GFAP)-positive areas in different groups; and (F–H) lithium chloride (LiCl) group. (B, F) NSCs that expressed green fluorescent protein (GFP) are shown in green color; (C, G) the GFAP-positive staining area of both control and LiCl group. The LiCl group had smaller GFAP-labeled area (E); (D, H) merged picture shows most GFAP-positive area of overlap with GFP-labeled area in control group. White arrow shows GFAP-negative area. *Compared with control group, P < 0.05.

