
Fig. 9.
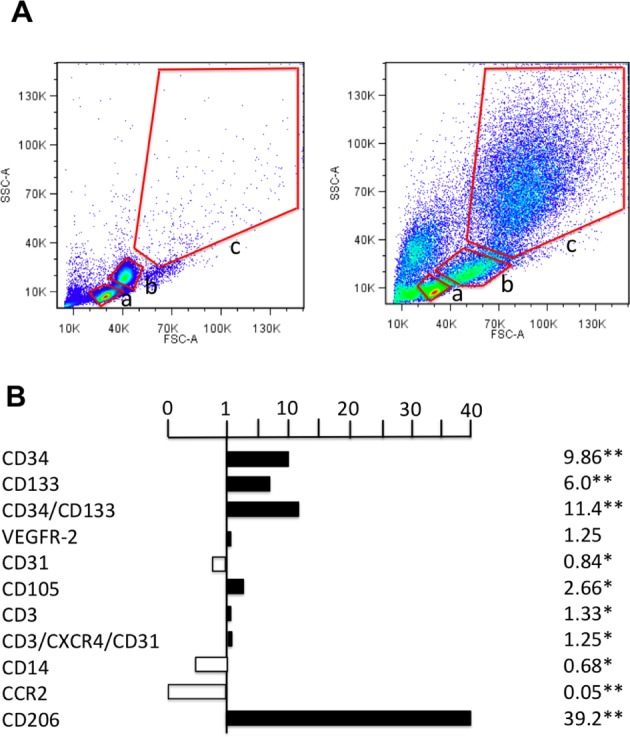
Flow cytometry (FCM) analysis of non-QQc PBMNCs and QQc PBMNCs. (A) Scatter diagrams of non-QQc PBMNCs and QQc PBMNCs by FCM analysis. The red lines indicate the cellular-sized gates of lymphocytes (a), monocytes (b), and the larger cells (c). (B) The graph shows the ratio of percent (%) cell positivity in QQc PBMNCs to that in non-QQc PBMNCs. n = 4 healthy volunteers. The investigated cell surface markers were as follows: hematopoietic stem cell (Cd34, CD133), endothelial cell (VEGFR-2, CD31, CD105), T cell (CD3, CD3/CXCR4/CD31), monocyte (CD14), M1 macrophage (CCR2), and M2 macrophage (CD206). Abbreviation: CCR2, CC chemokine receptor 2; FSC-A, forward scatter–area; SSC-A, side scatter–area; PBMNCs, peripheral blood mononuclear cells; QQc, quality and quantity control; VEGFR-2, vasular endotheilal growth factor recepor-2. *P < 0.05, **P < 0.01.