
Figure 5.
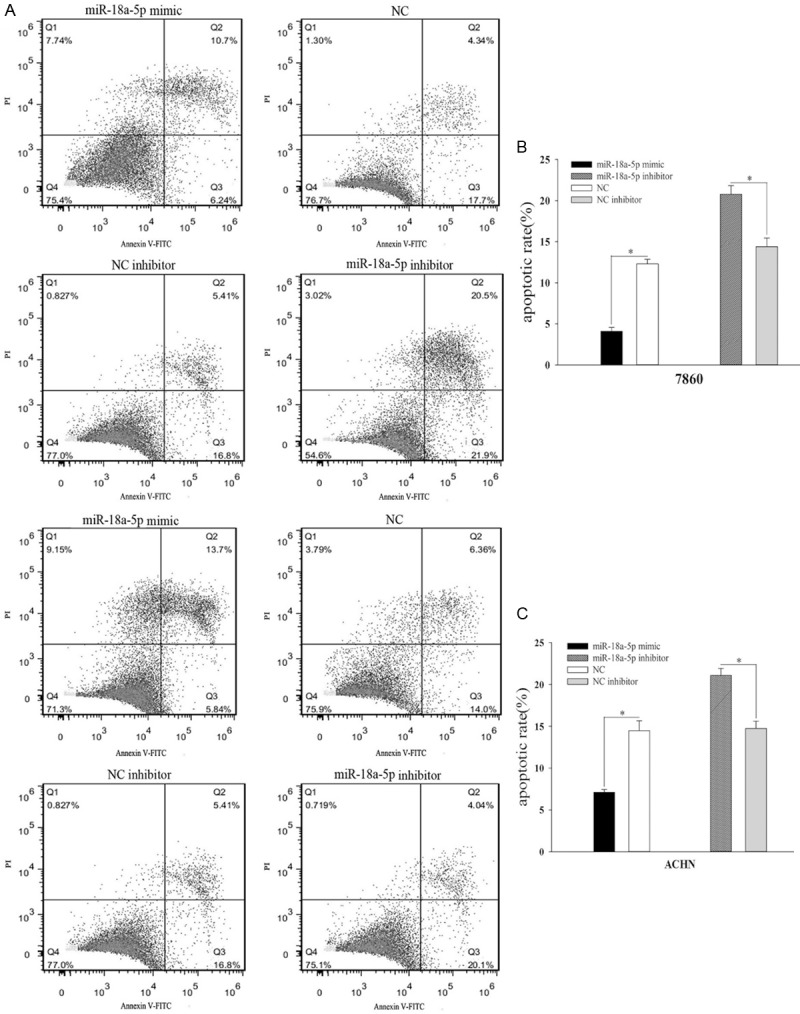
Result of flow cytometry assay. The distribution of 786-O and ACHN cells (A). The relative apoptotic rate of 786-O cell after transfection with miR-18a-5p mimic, inhibitor, NC, or NC inhibitor (B). The relative apoptotic rate of ACHN cell after transfection with miR-18a-5p mimic, inhibitor, NC, or NC inhibitor (C). *P < 0.05, **P < 0.01, ***P < 0.001. NC, negative control.