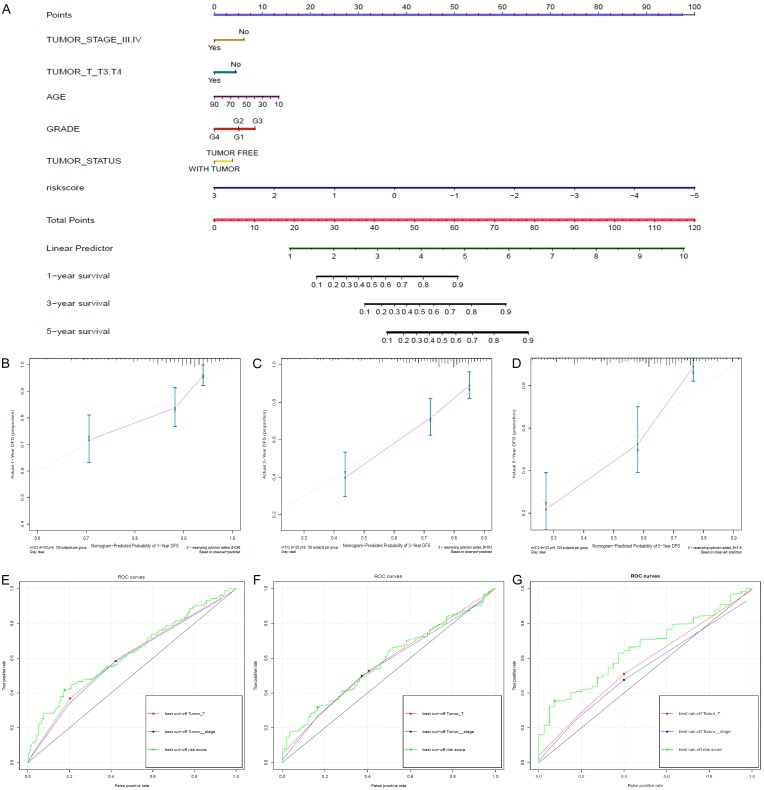
Figure 2.
A. Shows the OS prediction nomogram of the HCC patients. The risk factors include tumor stage ≥III, T stage ≥T3, grade 4 disease, older age, higher risk score and with-tumor status. B-D. Show the individual consistency curves for 1-year, 3-year and 5-year survival. The C-index of our nomogram is 0.701, suggesting good predictive ability. E-G. Show the individual ROC curves of the risk score, pathologic stage and pathologic T stage for the 1-year, 3-year and 5-year survival prediction models. The AUCs of the lncRNA-based risk score for the 1-year, 3-year and 5-year OS prediction models are 0.63, 0.58 and 0.65, respectively.

