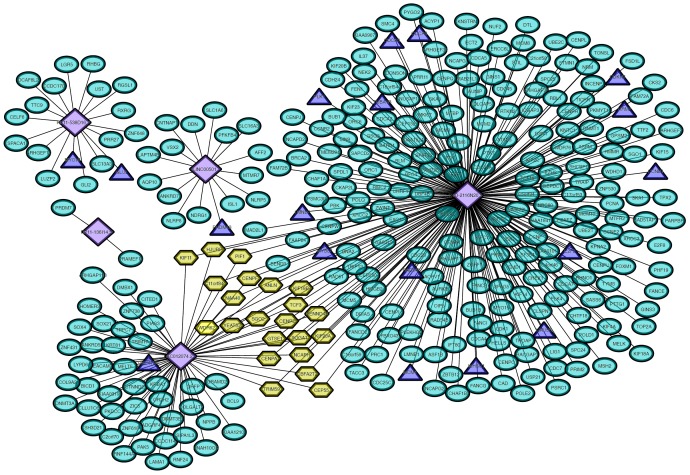
Figure 4.
A co-expression network of the prognostic lncRNAs and the expression levels of proteins in exosomes was established. Purple rhombuses represent the identified lncRNAs. Green ovals represent the proteins targeted by the GO term and KEGG pathway analyses. Exosomal proteins confirmed by both functional enrichment analysis and ExoCarta are indicated in blue triangles.

