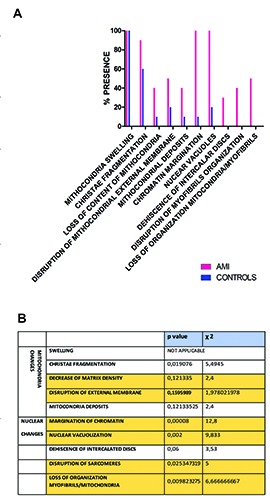
Figure 2.

Graphical representation of qualitative and quantitative differences in the ultrastructural features described in AMI vs control. A) In the x axis, the ultrastructural changes considered are listed. For each of them, the number of case in which the characteristic is present is represented by the column (pink for cases and blue for controls). B) Results of the statistical analysis of the myocardiocyte pathologic conditions observed at electron microscope, described qualitatively as present or absent.
