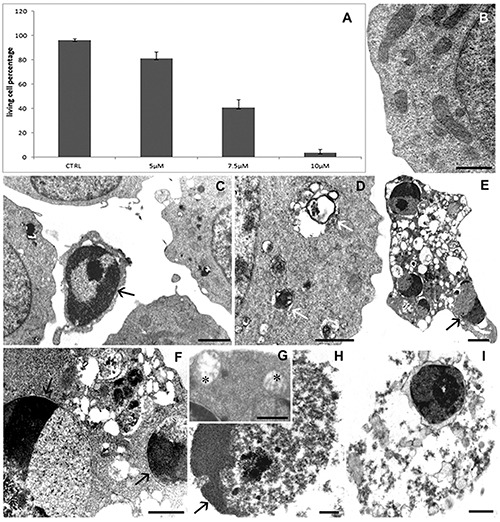
Figure 2.

TB exclusion assay (A) reveals a cell viability reduction after drug administration. Data are from three separate experiments and furnished as mean +/- standard deviation. TEM micrographs of U937 cells in control condition (B) and after 5 μM (C, D) or 7.5 μM (E-H) or 10 μM (I) alkaloid exposure. In B, a preserved morphology appears. After treatments autophagic structures (D, white arrows), apoptotic cells with condensed chromatin (C, E, F, H, black arrows) and empty mitochondria (G, asterisks) can be observed. In I, a necrotic cell is visible. Scale bars: B,D,F,I) 1 μm; C,E) 2 μm; G,H) 0.5 μm.
