Figure 4.

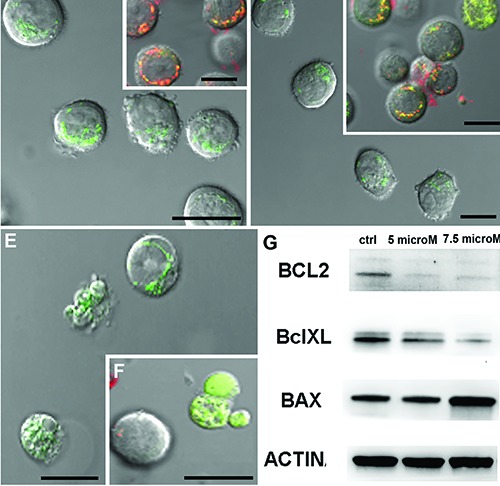
NAO (A,C,E) and JC-1 (B,D,F) fluorescence images of control condition (A,B) and of samples exposed to 5 μM (C,D) or 7.5 μM drug concentration (E,F). NAO fluorescence decreases after treatments (C,E) and JC1 staining (D,F) became green indicating a low mitochondrial potential. Scale bars: 10 μm. Western blotting analyses of Bcl-2 protein family activation (G) evidence an up-regulation of BclXL and BAX after BrBIn exposure.
