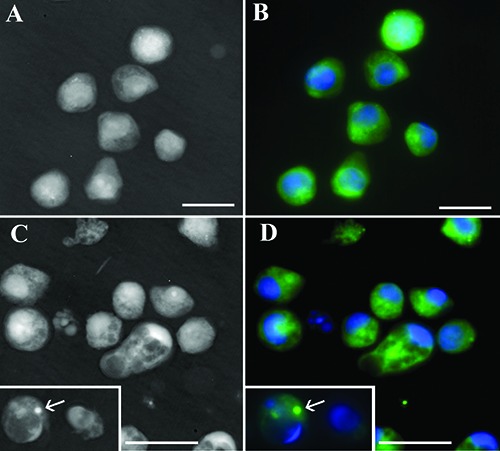
Figure 5.

Q-PHASE micrographs in phase (A,C) and fluorescence modality (B,D). Cells have been treated with fluorescent alkaloid molecule after 1 h (A,B) or 24 h (C,D) and stained with DAPI to monitor nuclear behavior. Apoptotic cells are visible in C and D, where the fluorescent compound is organized in punctate dots (arrows). Scale bars: 10 μm.
