
Figure 4.
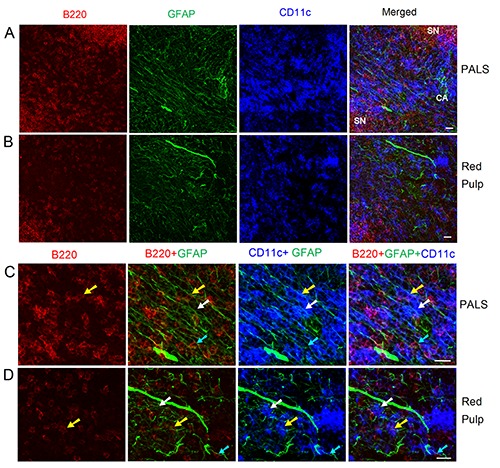
Distribution of NMSCs, B cells, and DCs in the PALS (a, c) and red pulp (b, d) of C57BL/6 mouse spleen. Antibodies against GFAP (green), B220 (red), and CD11c (blue) label mainly NMSCs, B cells, and DCs, respectively. c) High-resolution view of (a) to show the interaction of NMSCs and immune cells in PALS. d) High-resolution view of (b) to show the interaction of NMSCs and immune cells in red pulp; cyan arrows indicate a B220+ B cell closely associated with NMSC processes; white arrows show a B220- CD11c+ DC closely apposed to NMSC processes; yellow arrows indicate a B220+ CD11c+ DC with a close association with NMSC processes. CA, central artery; SN, splenic nodule; PALS, periarteriolar lymphoid sheath. Objective lens: 40x. Each image is a maximal intensity projection of a Z-stack. Stack size: 6.0 μm; optical slice interval: 0.50 μm. Scale bar: 20 μm.