
Fig. 4.
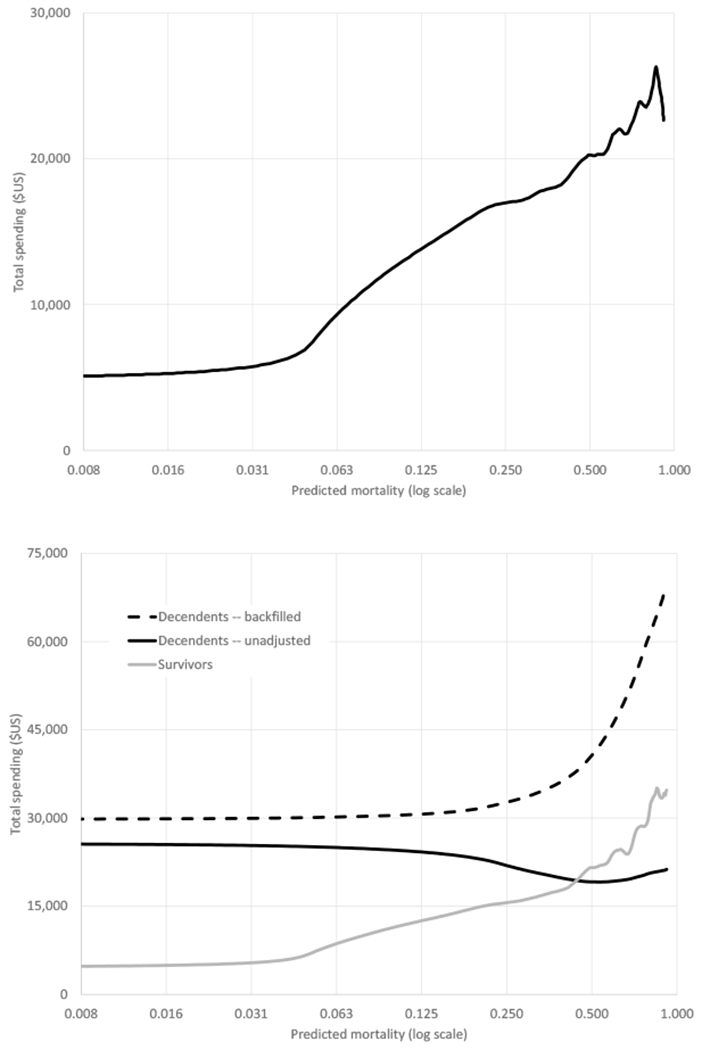
Spending by predicted mortality (log scale). Top panel shows kernel density of total Medicare spending in the 12 months after January 1, 2008, against predicted annual mortality (log scale). Bottom panel presents kernel density of Medicare spending separately for survivors and decedents. Spending measures are as defined in Fig. 1. All data are from the test subsample.