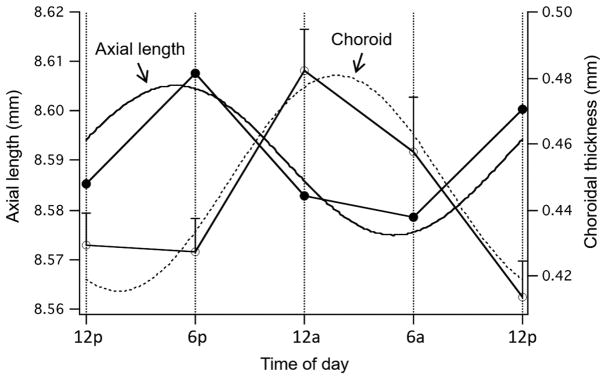
Figure 3.
Mean rhythms in axial length (black circles; left axis) and choroidal thickness (white circles; right axis) in normal chick eyes measured at 6 h intervals over 24 h. For axial length, the slope of the data for each eye (i.e., the underlying eye growth rate) was subtracted out to yield the ‘cyclic component.’ The curves are the sine waves with a fixed 24 h period fit to the data. From Nickla,143 with permission from Springer.

