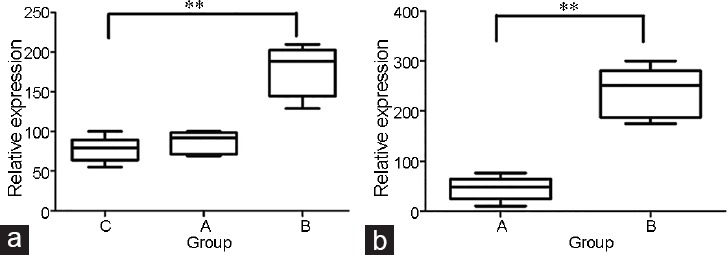
Figure 1.

Comparison of miR-192a expression in (a) seminal plasma and (b) testicular tissue. Panel a shows the expression levels of seminal miR-192a in Group B is over 2-fold higher than in Group A or the controls. (b) Similar results were obtained for testicular miR-192a expression between patients Group A and Group B. Group A: 27 men with spermatozoa in the ejaculate following surgery; Group B: 33 men without spermatozoa in the ejaculate follow surgery; Group C: 30 controls. **P < 0.001, the number is a relative level as relative to U6 snRNA, and the box is the 25th–75th centiles, the line is the median, the whiskers is the 10th and 90th centiles.
