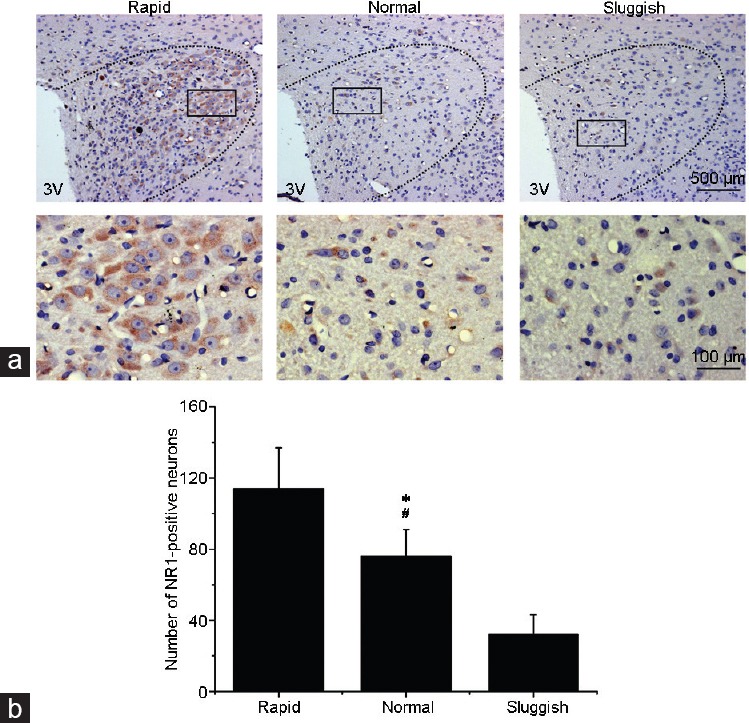
Figure 3.

(a) Immunohistochemical analysis of NMDANR1 distribution (brown color) in the PVN in “rapid,” “normal,” and “sluggish” rats. (b) Bar graph showing the number of NMDANR1-positive cells in the PVN. Values are presented as mean ± s.e. *P < 0.01, “normal” group compared with the “rapid” group; #P < 0.01, “normal” group compared with the “sluggish” group. 3V: third ventricle; NMDANR1: N-methyl-D-aspartic acid-NR1; PVN: paraventricular nucleus of the hypothalamus; s.e.: standard error.
