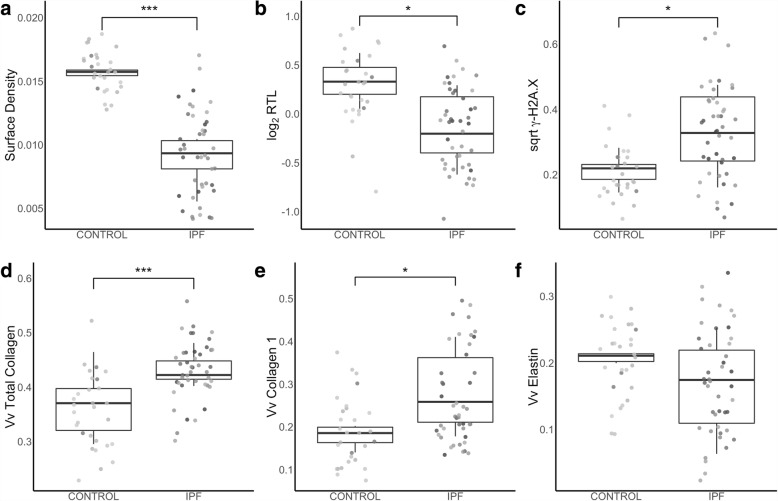
Fig. 1.
Comparison between control and IPF subjects for (a) surface density, (b) relative telomere length (RTL) and volume fractions of (c) γ-H2A.X, (d) total collagen, (e) collagen 1, and (f) elastin. Grey scale colour identifies each individual subject. Points represent measurements for each sample while boxplot shows distribution of the mean measurement from each subject. * p < 0.5, *** p < 0.001

