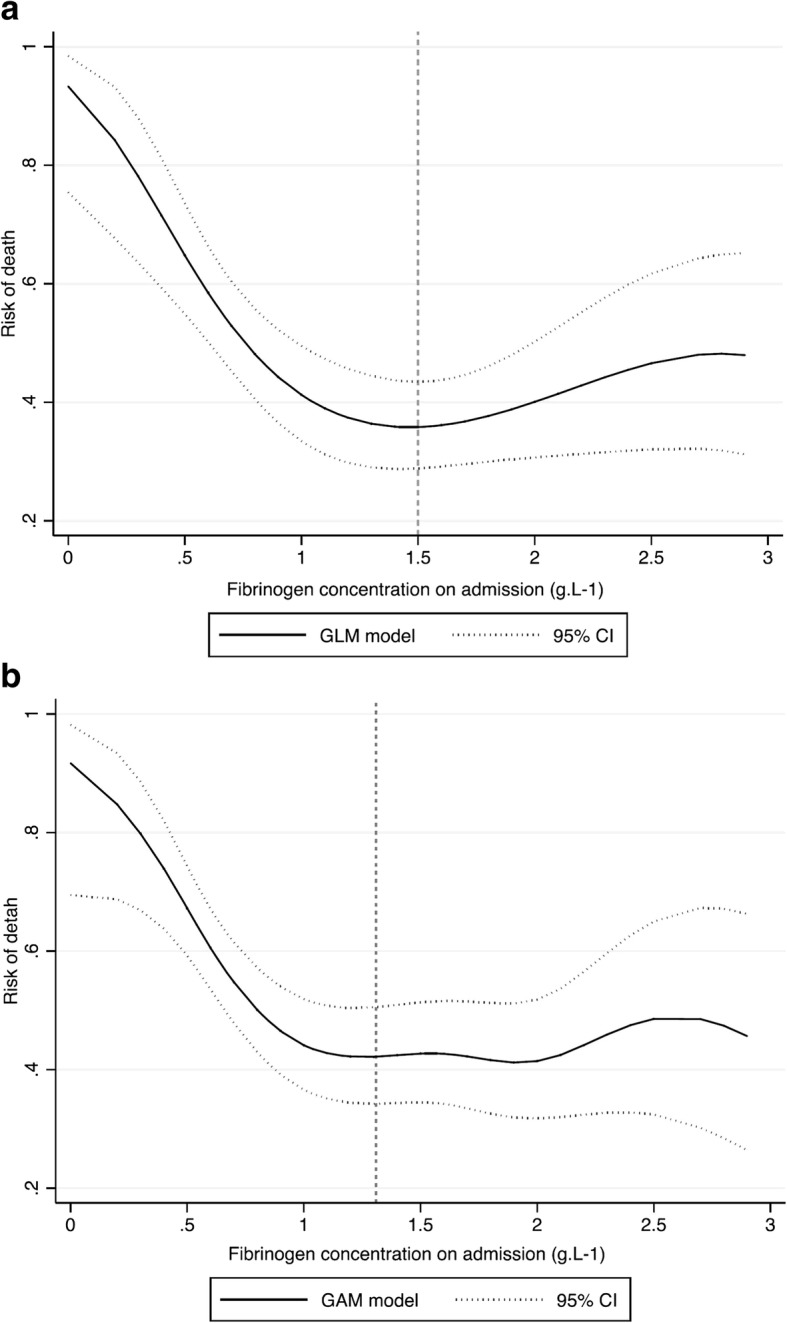
Fig. 2.

Modelling risk of death according to fibrinogen concentration: a. Generalized linear model (GLM) and b. Generalized additive model (GAM). Footnotes Fig. 2 (a) Mixed-Generalized Linear Model (GLM) with random effect on trauma center. Polynomial regression including quadratic and cubic terms. P value for linear term = 0.002; N = 363; C-stat = 0.62, Brier = 0.23; Predicted risk of death lowest value for fibrinogen concentration of 1.50 (b) Mixed-Generalized Additive Model (GAM) with random effect on trauma center and 6 equivalent degree of freedom (P value = 0.008). N = 363; Predicted risk of death lowest value for fibrinogen concentration of 1.31
