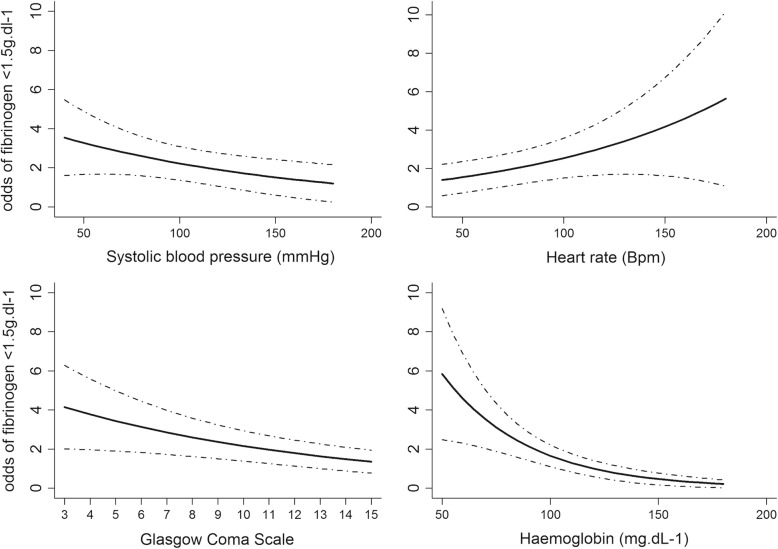
Fig. 3.
Predictors of low fibrinogen concentration in the generalized linear model (GLM). Each graph represents the relationship between a predictor (systolic blood pressure, heart rate, Glasgow coma scale and haemoglobin) and the odds of fibrinogen concentration < 1.5 g.L− 1. Footnotes Fig. 3 Mixed-Generalized Linear Model with random effect on trauma center; N = 362, C-stat = 0.75 95%CI (0.69–0.81), Brier score = 0.19

